General Motors 2010 Annual Report Download - page 93
Download and view the complete annual report
Please find page 93 of the 2010 General Motors annual report below. You can navigate through the pages in the report by either clicking on the pages listed below, or by using the keyword search tool below to find specific information within the annual report.-
 1
1 -
2
-
3
-
4
-
5
-
6
-
7
-
8
-
9
-
10
-
11
-
12
-
13
-
14
-
15
-
16
-
17
-
18
-
19
-
20
-
21
-
22
-
23
-
24
-
25
-
26
-
27
-
28
-
29
-
30
-
31
-
32
-
33
-
34
-
35
-
36
-
37
-
38
-
39
-
40
-
41
-
42
-
43
-
44
-
45
-
46
-
47
-
48
-
49
-
50
-
51
-
52
-
53
-
54
-
55
-
56
-
57
-
58
-
59
-
60
-
61
-
62
-
63
-
64
-
65
-
66
-
67
-
68
-
69
-
70
-
71
-
72
-
73
-
74
-
75
-
76
-
77
-
78
-
79
-
80
-
81
-
82
-
 83
83 -
 84
84 -
 85
85 -
 86
86 -
 87
87 -
 88
88 -
 89
89 -
 90
90 -
 91
91 -
 92
92 -
 93
93 -
 94
94 -
 95
95 -
 96
96 -
 97
97 -
 98
98 -
 99
99 -
 100
100 -
 101
101 -
 102
102 -
 103
103 -
104
-
105
-
106
-
107
-
108
-
109
-
110
-
111
-
112
-
113
-
114
-
115
-
116
-
117
-
118
-
119
-
120
-
121
-
122
-
123
-
124
-
125
-
126
-
127
-
128
-
129
-
130
-
131
-
132
-
133
-
134
-
135
-
136
-
137
-
138
-
139
-
140
-
141
-
142
-
143
-
144
-
145
-
146
-
147
-
148
-
149
-
150
-
151
-
152
-
153
-
154
-
155
-
156
-
157
-
158
-
159
-
160
-
161
-
162
-
163
-
164
-
165
-
166
-
167
-
168
-
169
-
170
-
171
-
172
-
173
-
174
-
175
-
176
-
177
-
178
-
179
-
180
-
181
-
182
-
183
-
184
-
185
-
186
-
187
-
188
-
189
-
190
-
191
-
192
-
193
-
194
-
195
-
196
-
197
-
198
-
199
-
200
-
201
-
202
-
203
-
204
-
205
-
206
-
207
-
208
-
209
-
210
-
211
-
212
-
213
-
214
-
215
-
216
-
217
-
218
-
219
-
220
-
221
-
222
-
223
-
224
-
225
-
226
-
227
-
228
-
229
-
230
-
231
-
232
-
233
-
234
-
235
-
236
-
237
-
238
-
239
-
240
-
241
-
242
-
243
-
244
-
245
-
246
-
247
-
248
-
249
-
250
-
251
-
252
-
253
-
254
-
255
-
256
-
257
-
258
-
259
-
260
-
261
-
262
-
263
-
264
-
265
-
266
-
267
-
268
-
269
-
270
-
271
-
272
-
273
-
274
-
275
-
276
-
277
-
278
-
279
-
280
-
281
-
282
-
283
-
284
-
285
-
286
-
287
-
288
-
289
-
290
 |
 |
GENERAL MOTORS COMPANY AND SUBSIDIARIES
In January 2011 we completed the previously announced voluntary contribution of 61 million shares of our common stock to our
U.S. hourly and salaried pension plans, valued at $2.2 billion for funding purposes. This was a voluntary contribution and the amount
is reflected in the plan assets used to project the future required contributions above since the contributed shares qualify as a plan asset
for funding purposes immediately. The contributed shares will qualify as a plan asset for accounting purposes when certain transfer
restrictions are removed, which is expected in 2011.
The hypothetical valuations do not consider the potential election of relief provisions that are available to us under the Pension
Relief Act of 2010 (PRA) for 2010 and 2011 plan year valuations.
We expect to contribute $95 million to our U.S. non-qualified plans and $740 million to our non-U.S. pension plans in 2011.
Fair Value Measurements
Automotive
At December 31, 2010 assets and liabilities classified in Level 3 were not significant. Prior to the three months ended December 31,
2010 significant assets and liabilities classified in Level 3, with the related Level 3 inputs, were as follows:
• Foreign currency derivatives — Level 3 inputs used to determine the fair value of foreign currency derivative liabilities
include the appropriate credit spread to measure our nonperformance risk. Given our nonperformance risk was not observable
through a liquid credit default swap market we based this measurement on an analysis of comparable industrial companies to
determine the appropriate credit spread which would be applied to us and Old GM by market participants. In the three months
ended December 31, 2010 we incorporated our published credit agency ratings into our credit rating conclusions. In the three
months ended December 31, 2010 we determined that our nonperformance risk no longer represents a significant input in the
determination of the fair value of our foreign currency derivative liabilities. We have transferred these liabilities to Level 2.
Refer to Notes 21 and 24 to our consolidated financial statements for additional information regarding fair value measurements.
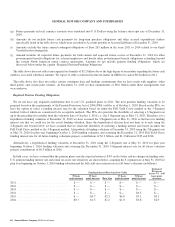
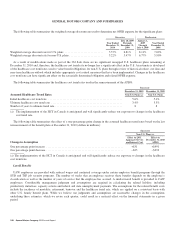
Level 3 Assets and Liabilities
At December 31, 2010 we used Level 3 inputs to measure net liabilities of $14 million (or less than 0.1%) of our total liabilities.
These net liabilities included $10 million (or less than 0.1%) of the total assets, and $24 million (or 16.4%) of the total liabilities that
we measured at fair value.
In the year ended December 31, 2010 assets and liabilities measured using Level 3 inputs decreased $658 million from a net
liability of $672 million to a net liability of $14 million. This reduction was primarily due to unrealized and realized gains on
derivatives, the settlement of derivative positions according to their terms and maturities and the reclassification of outstanding
derivative contracts from Level 3 to Level 2 during the three months ended December 31, 2010.
At December 31, 2010 our nonperformance risk remains unobservable through a liquid credit default swap market. During the three
months ended December 31, 2010 we determined that our nonperformance risk no longer represents significant input in the
determination of the fair value of our derivatives. The effect of our nonperformance risk in the valuation has been reduced due to the
reduction in the remaining duration and magnitude of these net derivative liability positions. In October 2010 we transferred foreign
currency derivatives with a fair market value of $183 million from Level 3 to Level 2.
At December 31, 2009 we used Level 3 inputs to measure net liabilities of $672 million (or 0.6%) of our total liabilities. These net
liabilities included $33 million (or 0.1%) of the total assets, and $705 million (or 98.7%) of the total liabilities (all of which were
derivative liabilities) that we measured at fair value. At December 31, 2009 we also included a nonperformance risk adjustment of
$47 million in the fair value measurement of these derivatives which reflects a discount of 6.5% to the fair value before considering
our credit risk.
General Motors Company 2010 Annual Report 91