General Motors 2010 Annual Report Download - page 218
Download and view the complete annual report
Please find page 218 of the 2010 General Motors annual report below. You can navigate through the pages in the report by either clicking on the pages listed below, or by using the keyword search tool below to find specific information within the annual report.-
 1
1 -
2
-
3
-
4
-
5
-
6
-
7
-
8
-
9
-
10
-
11
-
12
-
13
-
14
-
15
-
16
-
17
-
18
-
19
-
20
-
21
-
22
-
23
-
24
-
25
-
26
-
27
-
28
-
29
-
30
-
31
-
32
-
33
-
34
-
35
-
36
-
37
-
38
-
39
-
40
-
41
-
42
-
43
-
44
-
45
-
46
-
47
-
48
-
49
-
50
-
51
-
52
-
53
-
54
-
55
-
56
-
57
-
58
-
59
-
60
-
61
-
62
-
63
-
64
-
65
-
66
-
67
-
68
-
69
-
70
-
71
-
72
-
73
-
74
-
75
-
76
-
77
-
78
-
79
-
80
-
81
-
82
-
83
-
84
-
85
-
86
-
87
-
88
-
89
-
90
-
91
-
92
-
93
-
94
-
95
-
96
-
97
-
98
-
99
-
100
-
101
-
102
-
103
-
104
-
105
-
106
-
107
-
108
-
109
-
110
-
111
-
112
-
113
-
114
-
115
-
116
-
117
-
118
-
119
-
120
-
121
-
122
-
123
-
124
-
125
-
126
-
127
-
128
-
129
-
130
-
131
-
132
-
133
-
134
-
135
-
136
-
137
-
138
-
139
-
140
-
141
-
142
-
143
-
144
-
145
-
146
-
147
-
148
-
149
-
150
-
151
-
152
-
153
-
154
-
155
-
156
-
157
-
158
-
159
-
160
-
161
-
162
-
163
-
164
-
165
-
166
-
167
-
168
-
169
-
170
-
171
-
172
-
173
-
174
-
175
-
176
-
177
-
178
-
179
-
180
-
181
-
182
-
183
-
184
-
185
-
186
-
187
-
188
-
189
-
190
-
191
-
192
-
193
-
194
-
195
-
196
-
197
-
198
-
199
-
200
-
201
-
202
-
203
-
204
-
205
-
206
-
207
-
 208
208 -
 209
209 -
 210
210 -
 211
211 -
 212
212 -
 213
213 -
 214
214 -
 215
215 -
 216
216 -
 217
217 -
 218
218 -
 219
219 -
 220
220 -
 221
221 -
 222
222 -
 223
223 -
 224
224 -
 225
225 -
 226
226 -
 227
227 -
 228
228 -
229
-
230
-
231
-
232
-
233
-
234
-
235
-
236
-
237
-
238
-
239
-
240
-
241
-
242
-
243
-
244
-
245
-
246
-
247
-
248
-
249
-
250
-
251
-
252
-
253
-
254
-
255
-
256
-
257
-
258
-
259
-
260
-
261
-
262
-
263
-
264
-
265
-
266
-
267
-
268
-
269
-
270
-
271
-
272
-
273
-
274
-
275
-
276
-
277
-
278
-
279
-
280
-
281
-
282
-
283
-
284
-
285
-
286
-
287
-
288
-
289
-
290
 |
 |

GENERAL MOTORS COMPANY AND SUBSIDIARIES
NOTES TO CONSOLIDATED FINANCIAL STATEMENTS — (Continued)
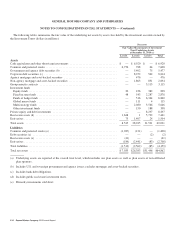
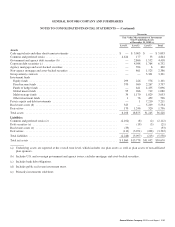
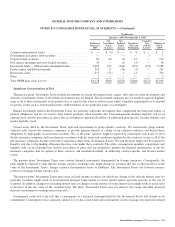
The following table summarizes the fair value of derivative assets and liabilities owned by the Investment Trusts by underlying risk
(dollars in millions):
Successor
December 31, 2010 December 31, 2009
Derivative assets
Interest rate contracts ..................................................................... $1,251 $ 1,297
Foreign exchange contracts ................................................................ 92 309
Equity contracts ......................................................................... 96 36
Credit contracts .......................................................................... 65 94
Total derivative assets .................................................................... 1,504 1,736
Derivative liabilities
Interest rate contracts ..................................................................... (2,294) (3,206)
Foreign exchange contracts ................................................................ (146) (76)
Equity contracts ......................................................................... (243) (49)
Credit contracts .......................................................................... (25) (61)
Total derivative liabilities .................................................................. (2,708) (3,392)
Total net derivative assets (liabilities) ........................................................ $(1,204) $(1,656)
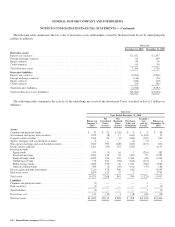
The following tables summarize the activity of the underlying net assets of the Investment Trusts classified in Level 3 (dollars in
millions):
Successor
Year Ended December 31, 2010
Balance at
January 1,
2010
Net
Unrealized
Gains
(Losses)
Net
Realized
Gains
(Losses)
Purchases,
Sales and
Settlements
Transfers
into
(out of)
Level 3
Balance at
December 31,
2010
Assets
Common and preferred stocks ................................. $ 53 $ 23 $ (20) $ 4 $ 4 $ 64
Government and agency debt securities ......................... 1,552 (8) 17 (163) (1,323) 75
Corporate debt securities ..................................... 1,764 56 (5) (543) (710) 562
Agency mortgage and asset-backed securities .................... 6 — — (1) (5) —
Non-agency mortgage and asset-backed securities ................. 1,525 393 (249) (167) (671) 831
Group annuity contracts ..................................... 3,301 (95) 161 (252) — 3,115
Investment funds
Equity funds ............................................ 576 (1) 16 7 (216) 382
Fixed income funds ....................................... 2,267 136 94 (307) 97 2,287
Funds of hedge funds ..................................... 4,455 103 325 1,500 (39) 6,344
Global macro funds ....................................... 719 103 (92) (614) (112) 4
Multi-strategy funds ...................................... 1,829 359 26 1,521 (169) 3,566
Other investment funds .................................... 459 (2) (29) (161) (79) 188
Private equity and debt investments ............................ 7,210 578 590 (81) — 8,297
Real estate assets ........................................... 5,209 523 57 3 — 5,792
Total assets ............................................... 30,925 2,168 891 746 (3,223) 31,507
Liabilities
Common and preferred stocks ................................. (2) — — — 2 —
Debt securities ............................................. (3) — — — 1 (2)
Total liabilities ............................................. (5) — — — 3 (2)
Derivatives, net ............................................ 112 (54) 3 (38) (82) (59)
Total net assets ............................................ $31,032 $2,114 $ 894 $ 708 $(3,302) $31,446
216 General Motors Company 2010 Annual Report