General Motors 2010 Annual Report Download - page 92
Download and view the complete annual report
Please find page 92 of the 2010 General Motors annual report below. You can navigate through the pages in the report by either clicking on the pages listed below, or by using the keyword search tool below to find specific information within the annual report.-
 1
1 -
2
-
3
-
4
-
5
-
6
-
7
-
8
-
9
-
10
-
11
-
12
-
13
-
14
-
15
-
16
-
17
-
18
-
19
-
20
-
21
-
22
-
23
-
24
-
25
-
26
-
27
-
28
-
29
-
30
-
31
-
32
-
33
-
34
-
35
-
36
-
37
-
38
-
39
-
40
-
41
-
42
-
43
-
44
-
45
-
46
-
47
-
48
-
49
-
50
-
51
-
52
-
53
-
54
-
55
-
56
-
57
-
58
-
59
-
60
-
61
-
62
-
63
-
64
-
65
-
66
-
67
-
68
-
69
-
70
-
71
-
72
-
73
-
74
-
75
-
76
-
77
-
78
-
79
-
80
-
81
-
 82
82 -
 83
83 -
 84
84 -
 85
85 -
 86
86 -
 87
87 -
 88
88 -
 89
89 -
 90
90 -
 91
91 -
 92
92 -
 93
93 -
 94
94 -
 95
95 -
 96
96 -
 97
97 -
 98
98 -
 99
99 -
 100
100 -
 101
101 -
 102
102 -
103
-
104
-
105
-
106
-
107
-
108
-
109
-
110
-
111
-
112
-
113
-
114
-
115
-
116
-
117
-
118
-
119
-
120
-
121
-
122
-
123
-
124
-
125
-
126
-
127
-
128
-
129
-
130
-
131
-
132
-
133
-
134
-
135
-
136
-
137
-
138
-
139
-
140
-
141
-
142
-
143
-
144
-
145
-
146
-
147
-
148
-
149
-
150
-
151
-
152
-
153
-
154
-
155
-
156
-
157
-
158
-
159
-
160
-
161
-
162
-
163
-
164
-
165
-
166
-
167
-
168
-
169
-
170
-
171
-
172
-
173
-
174
-
175
-
176
-
177
-
178
-
179
-
180
-
181
-
182
-
183
-
184
-
185
-
186
-
187
-
188
-
189
-
190
-
191
-
192
-
193
-
194
-
195
-
196
-
197
-
198
-
199
-
200
-
201
-
202
-
203
-
204
-
205
-
206
-
207
-
208
-
209
-
210
-
211
-
212
-
213
-
214
-
215
-
216
-
217
-
218
-
219
-
220
-
221
-
222
-
223
-
224
-
225
-
226
-
227
-
228
-
229
-
230
-
231
-
232
-
233
-
234
-
235
-
236
-
237
-
238
-
239
-
240
-
241
-
242
-
243
-
244
-
245
-
246
-
247
-
248
-
249
-
250
-
251
-
252
-
253
-
254
-
255
-
256
-
257
-
258
-
259
-
260
-
261
-
262
-
263
-
264
-
265
-
266
-
267
-
268
-
269
-
270
-
271
-
272
-
273
-
274
-
275
-
276
-
277
-
278
-
279
-
280
-
281
-
282
-
283
-
284
-
285
-
286
-
287
-
288
-
289
-
290
 |
 |

GENERAL MOTORS COMPANY AND SUBSIDIARIES
(g) Future payments in local currency amounts were translated into U.S. Dollars using the balance sheet spot rate at December 31,
2010.
(h) Amounts do not include future cash payments for long-term purchase obligations and other accrued expenditures (unless
specifically listed in the table above) which were recorded in Accounts payable or Accrued liabilities at December 31, 2010.
(i) Amounts exclude the future annual contingent obligations of Euro 265 million in the years 2011 to 2014 related to our Opel/
Vauxhall restructuring plan.
(j) Amount includes all expected future payments for both current and expected future service at December 31, 2010 for other
postretirement benefit obligations for salaried employees and hourly other postretirement benefit obligations extending beyond
the current North American union contract agreements. Amounts do not include pension funding obligations, which are
discussed below under the caption “Required Pension Funding Obligations.”
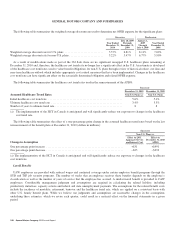
The table above does not reflect unrecognized tax benefits of $5.2 billion due to the high degree of uncertainty regarding the future cash
outflows associated with these amounts. We expect to settle a contested income tax matter in GMSA for cash of $0.2 billion in 2011.
The table above also does not reflect certain contingent loan and funding commitments that we have made with suppliers, other
third parties and certain joint ventures. At December 31, 2010 we had commitments of $0.6 billion under these arrangements that
were undrawn.
Required Pension Funding Obligations
We do not have any required contributions due to our U.S. qualified plans in 2011. The next pension funding valuation to be
prepared based on the requirements of the Pension Protection Act of 2006 (PPA) will be as of October 1, 2010. Based on the PPA, we
have the option to select a funding interest rate for the valuation based on either the Full Yield Curve method or the 3-Segment
method, both of which are considered to be acceptable methods. The PPA also provides the flexibility of selecting a 3-Segment rate
up to the preceding five months from the valuation date of October 1, 2010, i.e., the 3-Segment rate at May 31, 2010. Therefore, for a
hypothetical funding valuation at December 31, 2010 we have assumed the 3-Segment rate at May 31, 2010 as the base for funding
interest rate that we could use for the actual funding valuation. Since this hypothetical election does not limit us to only using the
3-Segment rate beyond 2010, we have assumed that we retain the flexibility of selecting a funding interest rate based on either the
Full Yield Curve method or the 3-Segment method. A hypothetical funding valuation at December 31, 2010 using the 3-Segment rate
at May 31, 2010 for plan year beginning October 1, 2010 funding valuation, and assuming the December 31, 2010 Full Yield Curve
funding interest rate for all future funding valuations projects contributions of $2.3 billion, and $1.2 billion in 2015 and 2016.
Alternatively, a hypothetical funding valuation at December 31, 2010 using the 3-Segment rate at May 31, 2010 for plan year
beginning October 1, 2010 funding valuation and assuming the December 31, 2010 3-Segment interest rate for all future valuation
projects contributions of $0.3 billion in 2016.
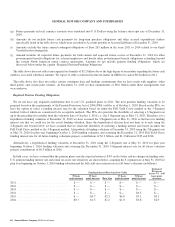
In both cases, we have assumed that the pension plans earn the expected return of 8.0% in the future and no changes in funding rates.
U.S. pension funding interest rate and return on assets rate sensitivity are shown below, assuming the 3-segment rate at May 31, 2010 for
plan year beginning on October 1, 2010 funding valuation and the full yield curve interest rate for all future valuations (in billions):
Funding Interest Rate Sensitivity Table
Estimated
Return on
Assets–7% - 100
basis point
decrease
50 basis
point increase
25 basis
point increase Base Line
25 basis
point decrease
50 basis
point decrease
2011 ................................... $— $— $— $— $— $—
2012 ................................... $— $— $— $— $— $—
2013 ................................... $— $— $— $— $— $—
2014 ................................... $— $— $— $— $0.5 $ —
2015 ................................... $— $0.7 $2.3 $4.0 $5.1 $3.1
2016 ................................... $0.7 $1.5 $1.2 $1.0 $0.8 $2.9
90 General Motors Company 2010 Annual Report