General Motors 2010 Annual Report Download - page 76
Download and view the complete annual report
Please find page 76 of the 2010 General Motors annual report below. You can navigate through the pages in the report by either clicking on the pages listed below, or by using the keyword search tool below to find specific information within the annual report.-
 1
1 -
2
-
3
-
4
-
5
-
6
-
7
-
8
-
9
-
10
-
11
-
12
-
13
-
14
-
15
-
16
-
17
-
18
-
19
-
20
-
21
-
22
-
23
-
24
-
25
-
26
-
27
-
28
-
29
-
30
-
31
-
32
-
33
-
34
-
35
-
36
-
37
-
38
-
39
-
40
-
41
-
42
-
43
-
44
-
45
-
46
-
47
-
48
-
49
-
50
-
51
-
52
-
53
-
54
-
55
-
56
-
57
-
58
-
59
-
60
-
61
-
62
-
63
-
64
-
65
-
 66
66 -
 67
67 -
 68
68 -
 69
69 -
 70
70 -
 71
71 -
 72
72 -
 73
73 -
 74
74 -
 75
75 -
 76
76 -
 77
77 -
 78
78 -
 79
79 -
 80
80 -
 81
81 -
 82
82 -
 83
83 -
 84
84 -
 85
85 -
 86
86 -
87
-
88
-
89
-
90
-
91
-
92
-
93
-
94
-
95
-
96
-
97
-
98
-
99
-
100
-
101
-
102
-
103
-
104
-
105
-
106
-
107
-
108
-
109
-
110
-
111
-
112
-
113
-
114
-
115
-
116
-
117
-
118
-
119
-
120
-
121
-
122
-
123
-
124
-
125
-
126
-
127
-
128
-
129
-
130
-
131
-
132
-
133
-
134
-
135
-
136
-
137
-
138
-
139
-
140
-
141
-
142
-
143
-
144
-
145
-
146
-
147
-
148
-
149
-
150
-
151
-
152
-
153
-
154
-
155
-
156
-
157
-
158
-
159
-
160
-
161
-
162
-
163
-
164
-
165
-
166
-
167
-
168
-
169
-
170
-
171
-
172
-
173
-
174
-
175
-
176
-
177
-
178
-
179
-
180
-
181
-
182
-
183
-
184
-
185
-
186
-
187
-
188
-
189
-
190
-
191
-
192
-
193
-
194
-
195
-
196
-
197
-
198
-
199
-
200
-
201
-
202
-
203
-
204
-
205
-
206
-
207
-
208
-
209
-
210
-
211
-
212
-
213
-
214
-
215
-
216
-
217
-
218
-
219
-
220
-
221
-
222
-
223
-
224
-
225
-
226
-
227
-
228
-
229
-
230
-
231
-
232
-
233
-
234
-
235
-
236
-
237
-
238
-
239
-
240
-
241
-
242
-
243
-
244
-
245
-
246
-
247
-
248
-
249
-
250
-
251
-
252
-
253
-
254
-
255
-
256
-
257
-
258
-
259
-
260
-
261
-
262
-
263
-
264
-
265
-
266
-
267
-
268
-
269
-
270
-
271
-
272
-
273
-
274
-
275
-
276
-
277
-
278
-
279
-
280
-
281
-
282
-
283
-
284
-
285
-
286
-
287
-
288
-
289
-
290
 |
 |
GENERAL MOTORS COMPANY AND SUBSIDIARIES
GM
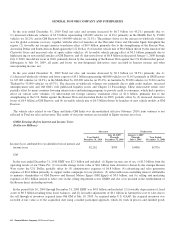
Total available liquidity increased by $9.1 billion in the year ended December 31, 2010 primarily due to positive cash flows from
operating activities of $6.6 billion, investing activities less net marketable securities acquisitions of $6.1 billion and a $5.3 billion
increase in amounts available under credit facilities, which were partially offset by negative cash flows from financing activities of
$9.3 billion.
Total available liquidity increased by $2.5 billion in the period July 10, 2009 through December 31, 2009 due to positive cash flows
from operating, financing and investing activities of $3.6 billion which were partially offset by a $1.1 billion reduction in our
borrowing capacity on certain credit facilities. The decrease in credit facilities is primarily attributable to the November 2009
extinguishment of the German Facility.
Old GM
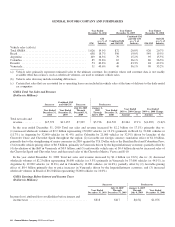
Total available liquidity increased by $6.0 billion in the period January 1, 2009 through July 9, 2009 due to positive cash flows
from financing activities partially offset by negative cash flow from operating and investing activities for a net cash flow of
$4.8 billion as well as an increase of $1.1 billion in available borrowing capacity under credit facilities. This was partially offset by
repayments of secured lending facilities.
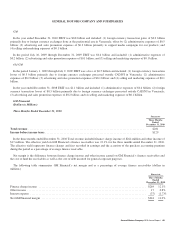
VEBA Assets
We transferred all of the remaining VEBA assets along with other consideration to the New VEBA within 10 business days after
December 31, 2009, in accordance with the terms of the 2009 UAW Retiree Settlement Agreement. The VEBA assets were not
consolidated after the settlement was recorded at December 31, 2009 because we did not hold a controlling financial interest in the
entity that held such assets at that date. Under the terms of the 2009 UAW Retiree Settlement Agreement we had an obligation for
VEBA Notes of $2.5 billion and accreted interest, at an implied interest rate of 9.0% per annum. In October 2010 we repaid in full the
outstanding amount (together with accreted interest thereon) of the VEBA Notes of $2.8 billion.
Under the terms of the 2009 UAW Retiree Settlement Agreement, we are released from UAW retiree healthcare claims incurred
after December 31, 2009. All obligations of ours, the New Plan and any other entity or benefit plan of ours for retiree medical benefits
for the class and the covered group arising from any agreement between us and the UAW terminated at December 31, 2009. Our
obligations to the New Plan and the New VEBA are limited to the terms of the 2009 UAW Retiree Settlement Agreement.
Series B Preferred Stock Issuance
In November and December 2010 we issued 100 million shares of our Series B Preferred Stock. Each share of our Series B
Preferred Stock is convertible at the option of the holder at any time prior to December 1, 2013 into 1.2626 shares of our common
stock, and each share of Series B Preferred Stock will mandatorily convert on December 1, 2013 into a number of shares of our
common stock ranging from 1.2626 to 1.5152 shares depending on the applicable market value of our common stock. The applicable
market value of our common stock means the average of the closing prices per share of our common stock over the 40 consecutive
trading day period ending on the third trading day immediately preceding the mandatory conversion date. The conversion ratios for
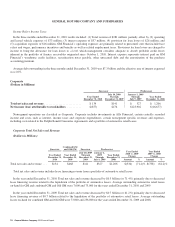
optional and mandatory conversions are subject to anti-dilution, make-whole and other adjustments. We received net proceeds from
the issuances of $4.9 billion. We used these proceeds, along with $1.2 billion of cash on hand, to purchase our Series A Preferred
Stock held by the UST in the amount of $2.1 billion and made a cash contribution to our U.S. hourly and salary pension plans in an
amount of $4.0 billion.
74 General Motors Company 2010 Annual Report