General Motors 2010 Annual Report Download - page 108
Download and view the complete annual report
Please find page 108 of the 2010 General Motors annual report below. You can navigate through the pages in the report by either clicking on the pages listed below, or by using the keyword search tool below to find specific information within the annual report.-
 1
1 -
2
-
3
-
4
-
5
-
6
-
7
-
8
-
9
-
10
-
11
-
12
-
13
-
14
-
15
-
16
-
17
-
18
-
19
-
20
-
21
-
22
-
23
-
24
-
25
-
26
-
27
-
28
-
29
-
30
-
31
-
32
-
33
-
34
-
35
-
36
-
37
-
38
-
39
-
40
-
41
-
42
-
43
-
44
-
45
-
46
-
47
-
48
-
49
-
50
-
51
-
52
-
53
-
54
-
55
-
56
-
57
-
58
-
59
-
60
-
61
-
62
-
63
-
64
-
65
-
66
-
67
-
68
-
69
-
70
-
71
-
72
-
73
-
74
-
75
-
76
-
77
-
78
-
79
-
80
-
81
-
82
-
83
-
84
-
85
-
86
-
87
-
88
-
89
-
90
-
91
-
92
-
93
-
94
-
95
-
96
-
97
-
 98
98 -
 99
99 -
 100
100 -
 101
101 -
 102
102 -
 103
103 -
 104
104 -
 105
105 -
 106
106 -
 107
107 -
 108
108 -
 109
109 -
 110
110 -
 111
111 -
 112
112 -
 113
113 -
 114
114 -
 115
115 -
 116
116 -
 117
117 -
 118
118 -
119
-
120
-
121
-
122
-
123
-
124
-
125
-
126
-
127
-
128
-
129
-
130
-
131
-
132
-
133
-
134
-
135
-
136
-
137
-
138
-
139
-
140
-
141
-
142
-
143
-
144
-
145
-
146
-
147
-
148
-
149
-
150
-
151
-
152
-
153
-
154
-
155
-
156
-
157
-
158
-
159
-
160
-
161
-
162
-
163
-
164
-
165
-
166
-
167
-
168
-
169
-
170
-
171
-
172
-
173
-
174
-
175
-
176
-
177
-
178
-
179
-
180
-
181
-
182
-
183
-
184
-
185
-
186
-
187
-
188
-
189
-
190
-
191
-
192
-
193
-
194
-
195
-
196
-
197
-
198
-
199
-
200
-
201
-
202
-
203
-
204
-
205
-
206
-
207
-
208
-
209
-
210
-
211
-
212
-
213
-
214
-
215
-
216
-
217
-
218
-
219
-
220
-
221
-
222
-
223
-
224
-
225
-
226
-
227
-
228
-
229
-
230
-
231
-
232
-
233
-
234
-
235
-
236
-
237
-
238
-
239
-
240
-
241
-
242
-
243
-
244
-
245
-
246
-
247
-
248
-
249
-
250
-
251
-
252
-
253
-
254
-
255
-
256
-
257
-
258
-
259
-
260
-
261
-
262
-
263
-
264
-
265
-
266
-
267
-
268
-
269
-
270
-
271
-
272
-
273
-
274
-
275
-
276
-
277
-
278
-
279
-
280
-
281
-
282
-
283
-
284
-
285
-
286
-
287
-
288
-
289
-
290
 |
 |

GENERAL MOTORS COMPANY AND SUBSIDIARIES
When available, quoted market prices are used to determine fair value. If quoted market prices are not available, fair value is based
upon valuation techniques that use, where possible, market-based inputs. Generally, fair value is estimated using a combination of the
income approach and the market approach because circumstances usually do not permit the use of a single approach. Under the
income approach, estimated future cash flows are discounted at a rate commensurate with the risk involved using marketplace
assumptions. Under the market approach, valuations are based on actual comparable market transactions and market earnings and
book value multiples for the same or comparable entities. The assumptions used in the income and market approaches have a
significant effect on the determination of fair value. Significant assumptions include estimated future cash flows, appropriate discount
rates, and adjustments to market transactions and market multiples for differences between the market data and the investment being
valued. Changes to these assumptions could have a significant effect on the valuation of cost and equity method investments.
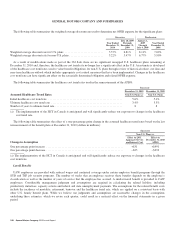
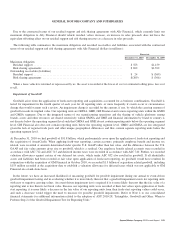
In the three months ended December 31, 2009 we recorded impairment charges related to our investment in Ally Financial common
stock of $270 million. We determined the fair value of our investment in Ally Financial common stock using a market multiple,
sum-of-the-parts methodology. This methodology considered the average price/tangible book value multiples of companies deemed
comparable to each of Ally Financial’s operations, which were then aggregated to determine Ally Financial’s overall fair value. Based
on our analysis, the estimated fair value of our investment in Ally Financial common stock was determined to be $970 million,
resulting in an impairment charge of $270 million. The following table illustrates the effect of a 0.1 change in the average price/
tangible book value multiple on our impairment charge (dollars in millions):
Change in Assumption
Effect on
December 31, 2009
Impairment Charges
Increase in average price/tangible book value multiple .......................................................... +$100
Decrease in average price/tangible book value multiple ......................................................... –$100
At December 31, 2010 the balance of our investment in Ally Financial common stock was $964 million and the balance of our
investment in Ally Financial preferred stock was $665 million.
Derivatives
Derivatives are used in the normal course of business to manage exposures arising from market risks resulting from changes in
certain commodity prices and interest and foreign currency exchange rates. Derivatives are accounted for in the consolidated balance
sheets as assets or liabilities at fair value.
Significant judgments and estimates are used in estimating the fair values of derivative instruments, particularly in the absence of
quoted market prices. Internal models are used to value a majority of derivatives. The models use, as their basis, readily observable
market inputs, such as time value, forward interest rates, volatility factors, and current and forward market prices for commodities and
foreign currency exchange rates.
The valuation of derivative liabilities takes into account our nonperformance risk. At December 31, 2010 and December 31, 2009,
our nonperformance risk was not observable through a liquid credit default swap market. Our nonperformance risk was estimated
using internal analysis to develop conclusions on our implied credit rating, which we used to determine the appropriate credit spread,
which would be applied to us by market participants. Prior to receiving published credit ratings we developed our credit rating
conclusions using an analysis of comparable industrial companies. At December 31, 2010 we incorporated published credit agency
ratings of GM into our credit rating conclusions. At December 31, 2009, all derivatives whose fair values contained a significant
credit adjustment based on our nonperformance risk were classified in Level 3. At December 31, 2010, we have determined that our
non-performance risk no longer represents a significant input in the determination of the fair value of our derivatives. As of
December 31, 2010 all automotive operations derivatives have been classified in Level 2.
Sales Incentives
The estimated effect of sales incentives to dealers and customers is recorded as a reduction of Automotive revenue, and in certain
instances, as an increase to Automotive cost of sales, at the later of the time of sale or announcement of an incentive program to
dealers. There may be numerous types of incentives available at any particular time, including a choice of incentives for a specific
106 General Motors Company 2010 Annual Report