General Motors 2010 Annual Report Download - page 46
Download and view the complete annual report
Please find page 46 of the 2010 General Motors annual report below. You can navigate through the pages in the report by either clicking on the pages listed below, or by using the keyword search tool below to find specific information within the annual report.-
 1
1 -
2
-
3
-
4
-
5
-
6
-
7
-
8
-
9
-
10
-
11
-
12
-
13
-
14
-
15
-
16
-
17
-
18
-
19
-
20
-
21
-
22
-
23
-
24
-
25
-
26
-
27
-
28
-
29
-
30
-
31
-
32
-
33
-
34
-
35
-
 36
36 -
 37
37 -
 38
38 -
 39
39 -
 40
40 -
 41
41 -
 42
42 -
 43
43 -
 44
44 -
 45
45 -
 46
46 -
 47
47 -
 48
48 -
 49
49 -
 50
50 -
 51
51 -
 52
52 -
 53
53 -
 54
54 -
 55
55 -
 56
56 -
57
-
58
-
59
-
60
-
61
-
62
-
63
-
64
-
65
-
66
-
67
-
68
-
69
-
70
-
71
-
72
-
73
-
74
-
75
-
76
-
77
-
78
-
79
-
80
-
81
-
82
-
83
-
84
-
85
-
86
-
87
-
88
-
89
-
90
-
91
-
92
-
93
-
94
-
95
-
96
-
97
-
98
-
99
-
100
-
101
-
102
-
103
-
104
-
105
-
106
-
107
-
108
-
109
-
110
-
111
-
112
-
113
-
114
-
115
-
116
-
117
-
118
-
119
-
120
-
121
-
122
-
123
-
124
-
125
-
126
-
127
-
128
-
129
-
130
-
131
-
132
-
133
-
134
-
135
-
136
-
137
-
138
-
139
-
140
-
141
-
142
-
143
-
144
-
145
-
146
-
147
-
148
-
149
-
150
-
151
-
152
-
153
-
154
-
155
-
156
-
157
-
158
-
159
-
160
-
161
-
162
-
163
-
164
-
165
-
166
-
167
-
168
-
169
-
170
-
171
-
172
-
173
-
174
-
175
-
176
-
177
-
178
-
179
-
180
-
181
-
182
-
183
-
184
-
185
-
186
-
187
-
188
-
189
-
190
-
191
-
192
-
193
-
194
-
195
-
196
-
197
-
198
-
199
-
200
-
201
-
202
-
203
-
204
-
205
-
206
-
207
-
208
-
209
-
210
-
211
-
212
-
213
-
214
-
215
-
216
-
217
-
218
-
219
-
220
-
221
-
222
-
223
-
224
-
225
-
226
-
227
-
228
-
229
-
230
-
231
-
232
-
233
-
234
-
235
-
236
-
237
-
238
-
239
-
240
-
241
-
242
-
243
-
244
-
245
-
246
-
247
-
248
-
249
-
250
-
251
-
252
-
253
-
254
-
255
-
256
-
257
-
258
-
259
-
260
-
261
-
262
-
263
-
264
-
265
-
266
-
267
-
268
-
269
-
270
-
271
-
272
-
273
-
274
-
275
-
276
-
277
-
278
-
279
-
280
-
281
-
282
-
283
-
284
-
285
-
286
-
287
-
288
-
289
-
290
 |
 |

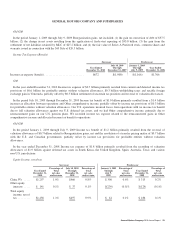
GENERAL MOTORS COMPANY AND SUBSIDIARIES
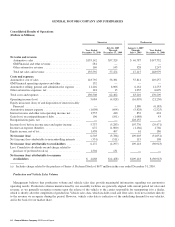
Consolidated Results of Operations
(Dollars in Millions)
Successor Predecessor
Year Ended
December 31, 2010
July 10, 2009
Through
December 31, 2009
January 1, 2009
Through
July 9, 2009
Year Ended
December 31, 2008
Net sales and revenue
Automotive sales ................................ $135,142 $57,329 $ 46,787 $147,732
GM Financial and other revenue .................... 281 — — —
Other automotive revenue ......................... 169 145 328 1,247
Total net sales and revenue ........................ 135,592 57,474 47,115 148,979
Costs and expenses
Automotive cost of sales ............................ 118,792 56,381 55,814 149,257
GM Financial operating expenses and other ............. 152 — — —
Automotive selling, general and administrative expense . . . 11,446 6,006 6,161 14,253
Other automotive expenses, net ....................... 118 15 1,235 6,699
Total costs and expenses ............................ 130,508 62,402 63,210 170,209
Operating income (loss) ............................ 5,084 (4,928) (16,095) (21,230)
Equity in income (loss) of and disposition of interest in Ally
Financial ...................................... — — 1,380 (6,183)
Automotive interest expense ......................... (1,098) (694) (5,428) (2,525)
Interest income and other non-operating income, net ...... 1,555 440 852 424
Gain (loss) on extinguishment of debt ................. 196 (101) (1,088) 43
Reorganization gains, net ........................... — — 128,155 —
Income (loss) before income taxes and equity income ..... 5,737 (5,283) 107,776 (29,471)
Income tax expense (benefit) ......................... 672 (1,000) (1,166) 1,766
Equity income, net of tax ............................ 1,438 497 61 186
Net income (loss) ................................. 6,503 (3,786) 109,003 (31,051)
Net (income) loss attributable to noncontrolling interests . . (331) (511) 115 108
Net income (loss) attributable to stockholders ......... 6,172 (4,297) 109,118 (30,943)
Less: Cumulative dividends on and charge related to
purchase of preferred stock (a) ..................... 1,504 131 — —
Net income (loss) attributable to common
stockholders ................................... $ 4,668 $ (4,428) $109,118 $ (30,943)
(a) Includes charge related to the purchase of Series A Preferred Stock of $677 million in the year ended December 31, 2010.
Production and Vehicle Sales Volume
Management believes that production volume and vehicle sales data provide meaningful information regarding our automotive
operating results. Production volumes manufactured by our assembly facilities are generally aligned with current period net sales and
revenue, as we generally recognize revenue upon the release of the vehicle to the carrier responsible for transporting it to a dealer,
which is shortly after the completion of production. Vehicle sales data, which includes retail and fleet sales, does not correlate directly
to the revenue we recognize during the period. However, vehicle sales data is indicative of the underlying demand for our vehicles,
and is the basis for our market share.
44 General Motors Company 2010 Annual Report