General Motors 2010 Annual Report Download - page 170
Download and view the complete annual report
Please find page 170 of the 2010 General Motors annual report below. You can navigate through the pages in the report by either clicking on the pages listed below, or by using the keyword search tool below to find specific information within the annual report.-
 1
1 -
2
-
3
-
4
-
5
-
6
-
7
-
8
-
9
-
10
-
11
-
12
-
13
-
14
-
15
-
16
-
17
-
18
-
19
-
20
-
21
-
22
-
23
-
24
-
25
-
26
-
27
-
28
-
29
-
30
-
31
-
32
-
33
-
34
-
35
-
36
-
37
-
38
-
39
-
40
-
41
-
42
-
43
-
44
-
45
-
46
-
47
-
48
-
49
-
50
-
51
-
52
-
53
-
54
-
55
-
56
-
57
-
58
-
59
-
60
-
61
-
62
-
63
-
64
-
65
-
66
-
67
-
68
-
69
-
70
-
71
-
72
-
73
-
74
-
75
-
76
-
77
-
78
-
79
-
80
-
81
-
82
-
83
-
84
-
85
-
86
-
87
-
88
-
89
-
90
-
91
-
92
-
93
-
94
-
95
-
96
-
97
-
98
-
99
-
100
-
101
-
102
-
103
-
104
-
105
-
106
-
107
-
108
-
109
-
110
-
111
-
112
-
113
-
114
-
115
-
116
-
117
-
118
-
119
-
120
-
121
-
122
-
123
-
124
-
125
-
126
-
127
-
128
-
129
-
130
-
131
-
132
-
133
-
134
-
135
-
136
-
137
-
138
-
139
-
140
-
141
-
142
-
143
-
144
-
145
-
146
-
147
-
148
-
149
-
150
-
151
-
152
-
153
-
154
-
155
-
156
-
157
-
158
-
159
-
 160
160 -
 161
161 -
 162
162 -
 163
163 -
 164
164 -
 165
165 -
 166
166 -
 167
167 -
 168
168 -
 169
169 -
 170
170 -
 171
171 -
 172
172 -
 173
173 -
 174
174 -
 175
175 -
 176
176 -
 177
177 -
 178
178 -
 179
179 -
 180
180 -
181
-
182
-
183
-
184
-
185
-
186
-
187
-
188
-
189
-
190
-
191
-
192
-
193
-
194
-
195
-
196
-
197
-
198
-
199
-
200
-
201
-
202
-
203
-
204
-
205
-
206
-
207
-
208
-
209
-
210
-
211
-
212
-
213
-
214
-
215
-
216
-
217
-
218
-
219
-
220
-
221
-
222
-
223
-
224
-
225
-
226
-
227
-
228
-
229
-
230
-
231
-
232
-
233
-
234
-
235
-
236
-
237
-
238
-
239
-
240
-
241
-
242
-
243
-
244
-
245
-
246
-
247
-
248
-
249
-
250
-
251
-
252
-
253
-
254
-
255
-
256
-
257
-
258
-
259
-
260
-
261
-
262
-
263
-
264
-
265
-
266
-
267
-
268
-
269
-
270
-
271
-
272
-
273
-
274
-
275
-
276
-
277
-
278
-
279
-
280
-
281
-
282
-
283
-
284
-
285
-
286
-
287
-
288
-
289
-
290
 |
 |

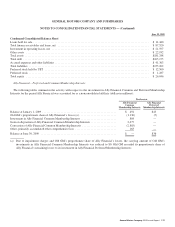
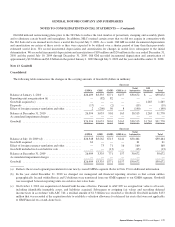
GENERAL MOTORS COMPANY AND SUBSIDIARIES
NOTES TO CONSOLIDATED FINANCIAL STATEMENTS — (Continued)
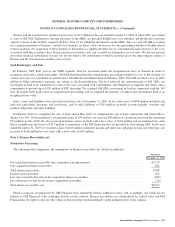
Note 8. Marketable Securities
Automotive
The following table summarizes information regarding marketable securities (dollars in millions):
Successor
December 31, 2010 December 31, 2009
Cost
Unrealized Fair
Value Cost
Unrealized Fair
ValueGains Losses Gains Losses
Marketable Securities
Available-for-sale securities
United States government and agencies ...................... $2,023 $— $— $2,023 $ 2 $— $— $ 2
Sovereign debt .......................................... 773 — — 773 — — — —
Certificates of deposit .................................... 954 — — 954 8 — — 8
Corporate debt .......................................... 1,670 1 2 1,669 — — — —
Total available-for-sale securities ............................. 5,420 1 2 5,419 10 — — 10
Total trading securities ..................................... 129 10 3 136 122 7 5 124
Total Marketable securities .................................. $5,549 $11 $ 5 $5,555 $132 $ 7 $ 5 $134
We maintained $89 million and $79 million of the above trading securities as compensating balances to support letters of credit of
$74 million and $66 million at December 31, 2010 and 2009. We have access to these securities in the normal course of business;
however, the letters of credit may be withdrawn if the minimum collateral balance is not maintained.
The following table summarizes securities classified as Cash and cash equivalents and Restricted cash and marketable securities
(dollars in millions):
Successor
December 31, 2010 December 31, 2009
Securities classified as Cash and cash equivalents ...................................... $12,964 $11,176
Securities classified as Restricted cash and marketable securities .......................... $ 1,474 $14,178
Refer to Note 24 for classes of securities underlying Cash and cash equivalents and Restricted cash and marketable securities.
The following table summarizes proceeds from and realized gains and losses on disposals of investments in marketable securities
classified as available-for-sale and sold prior to maturity (dollars in millions):
Successor Predecessor
Year Ended
December 31, 2010
July 10, 2009
Through
December 31, 2009
January 1, 2009
Through
July 9, 2009
Year Ended
December 31, 2008
Sales proceeds ...................................... $11 $ 3 $185 $4,001
Realized gains ...................................... $— $— $ 3 $ 44
Realized losses ...................................... $— $— $ 10 $ 88
168 General Motors Company 2010 Annual Report