General Motors 2010 Annual Report Download - page 84
Download and view the complete annual report
Please find page 84 of the 2010 General Motors annual report below. You can navigate through the pages in the report by either clicking on the pages listed below, or by using the keyword search tool below to find specific information within the annual report.-
 1
1 -
2
-
3
-
4
-
5
-
6
-
7
-
8
-
9
-
10
-
11
-
12
-
13
-
14
-
15
-
16
-
17
-
18
-
19
-
20
-
21
-
22
-
23
-
24
-
25
-
26
-
27
-
28
-
29
-
30
-
31
-
32
-
33
-
34
-
35
-
36
-
37
-
38
-
39
-
40
-
41
-
42
-
43
-
44
-
45
-
46
-
47
-
48
-
49
-
50
-
51
-
52
-
53
-
54
-
55
-
56
-
57
-
58
-
59
-
60
-
61
-
62
-
63
-
64
-
65
-
66
-
67
-
68
-
69
-
70
-
71
-
72
-
73
-
 74
74 -
 75
75 -
 76
76 -
 77
77 -
 78
78 -
 79
79 -
 80
80 -
 81
81 -
 82
82 -
 83
83 -
 84
84 -
 85
85 -
 86
86 -
 87
87 -
 88
88 -
 89
89 -
 90
90 -
 91
91 -
 92
92 -
 93
93 -
 94
94 -
95
-
96
-
97
-
98
-
99
-
100
-
101
-
102
-
103
-
104
-
105
-
106
-
107
-
108
-
109
-
110
-
111
-
112
-
113
-
114
-
115
-
116
-
117
-
118
-
119
-
120
-
121
-
122
-
123
-
124
-
125
-
126
-
127
-
128
-
129
-
130
-
131
-
132
-
133
-
134
-
135
-
136
-
137
-
138
-
139
-
140
-
141
-
142
-
143
-
144
-
145
-
146
-
147
-
148
-
149
-
150
-
151
-
152
-
153
-
154
-
155
-
156
-
157
-
158
-
159
-
160
-
161
-
162
-
163
-
164
-
165
-
166
-
167
-
168
-
169
-
170
-
171
-
172
-
173
-
174
-
175
-
176
-
177
-
178
-
179
-
180
-
181
-
182
-
183
-
184
-
185
-
186
-
187
-
188
-
189
-
190
-
191
-
192
-
193
-
194
-
195
-
196
-
197
-
198
-
199
-
200
-
201
-
202
-
203
-
204
-
205
-
206
-
207
-
208
-
209
-
210
-
211
-
212
-
213
-
214
-
215
-
216
-
217
-
218
-
219
-
220
-
221
-
222
-
223
-
224
-
225
-
226
-
227
-
228
-
229
-
230
-
231
-
232
-
233
-
234
-
235
-
236
-
237
-
238
-
239
-
240
-
241
-
242
-
243
-
244
-
245
-
246
-
247
-
248
-
249
-
250
-
251
-
252
-
253
-
254
-
255
-
256
-
257
-
258
-
259
-
260
-
261
-
262
-
263
-
264
-
265
-
266
-
267
-
268
-
269
-
270
-
271
-
272
-
273
-
274
-
275
-
276
-
277
-
278
-
279
-
280
-
281
-
282
-
283
-
284
-
285
-
286
-
287
-
288
-
289
-
290
 |
 |
GENERAL MOTORS COMPANY AND SUBSIDIARIES
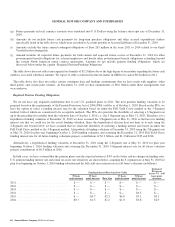
Financing Activities
GM
In the year ended December 31, 2010 we had negative cash flows from financing activities of $9.3 billion primarily due to:
(1) repayments on the UST Loans and Canadian Loan of $5.7 billion and $1.3 billion; (2) principal payments on the VEBA Notes of
$2.5 billion; (3) purchase of the Series A Preferred Stock shares from the UST of $2.1 billion; (4) repayment of GM Daewoo’s
revolving credit facility of $1.2 billion; (5) dividend payments on our Series A Preferred Stock of $0.8 billion; (6) payments on the
Receivables Program of $0.2 billion; (7) debt issuance fees of $0.2 billion primarily related to establishing our secured revolving
credit facility; (8) net payments on other debt of $0.2 billion; partially offset by (9) proceeds from the issuance of Series B Preferred
Stock of $4.9 billion.
In the period July 10, 2009 through December 31, 2009 we had positive cash flows from financing activities of $0.3 billion
primarily due to: (1) funding of $4.0 billion from the EDC which was converted to our equity; partially offset by (2) payments on the
UST Loans of $1.4 billion (including payments of $0.4 billion related to the warranty program); (3) net payments on the German
Facility of $1.1 billion; (4) net payments on other debt of $0.4 billion; (5) a net decrease in short-term debt of $0.4 billion;
(6) payment on the Canadian Loan of $0.2 billion; (7) net payments on the program announced in March 2009 by the UST to provide
financial assistance to automotive suppliers (Receivables Program) of $0.1 billion; and (8) dividend payments on our Series A
Preferred Stock of $0.1 billion.
Old GM
In the period January 1, 2009 through July 9, 2009 Old GM had positive cash flows from financing activities of $44.2 billion
primarily due to: (1) proceeds from the DIP Facility of $33.3 billion; (2) proceeds from the UST Loan Facility and UST Ally
Financial Loan of $16.6 billion; (3) proceeds from the EDC Loan Facility of $2.4 billion; (4) proceeds from the German Facility of
$1.0 billion; (5) proceeds from the issuance of long-term debt of $0.3 billion; (6) proceeds from the Receivables Program of
$0.3 billion; partially offset by (7) payments on other debt of $6.1 billion; (8) a net decrease in short-term debt of $2.4 billion; and
(9) cash of $1.2 billion MLC retained as part of the 363 Sale.
In the year ended December 31, 2008 Old GM had positive cash flows from financing activities of $3.8 billion primarily related to:
(1) borrowings on debt facilities of $5.9 billion; (2) borrowing on the UST Loan Facility of $4.0 billion; partially offset by (3) a net
decrease in short-term debt of $4.1 billion; (4) debt repayments of $1.7 billion; and (5) dividend payments on Old GM common stock
of $0.3 billion.
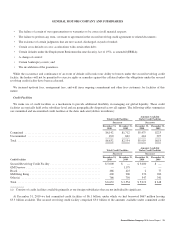
Net Liquid Assets
Management believes the use of net liquid assets provides meaningful supplemental information regarding our liquidity. We
believe net liquid assets is useful in allowing for greater transparency of supplemental information used by management in its
financial and operational decision making to assist in identifying resources available to meet cash requirements. Our calculation of net
liquid assets may not be completely comparable to similarly titled measures of other companies due to potential differences between
companies in the method of calculation. As a result, the use of net liquid assets has limitations and should not be considered in
isolation from, or as a substitute for, other measures such as Cash and cash equivalents and Debt. Due to these limitations, net liquid
assets is used as a supplement to U.S. GAAP measures.
82 General Motors Company 2010 Annual Report