General Motors 2010 Annual Report Download - page 174
Download and view the complete annual report
Please find page 174 of the 2010 General Motors annual report below. You can navigate through the pages in the report by either clicking on the pages listed below, or by using the keyword search tool below to find specific information within the annual report.-
 1
1 -
2
-
3
-
4
-
5
-
6
-
7
-
8
-
9
-
10
-
11
-
12
-
13
-
14
-
15
-
16
-
17
-
18
-
19
-
20
-
21
-
22
-
23
-
24
-
25
-
26
-
27
-
28
-
29
-
30
-
31
-
32
-
33
-
34
-
35
-
36
-
37
-
38
-
39
-
40
-
41
-
42
-
43
-
44
-
45
-
46
-
47
-
48
-
49
-
50
-
51
-
52
-
53
-
54
-
55
-
56
-
57
-
58
-
59
-
60
-
61
-
62
-
63
-
64
-
65
-
66
-
67
-
68
-
69
-
70
-
71
-
72
-
73
-
74
-
75
-
76
-
77
-
78
-
79
-
80
-
81
-
82
-
83
-
84
-
85
-
86
-
87
-
88
-
89
-
90
-
91
-
92
-
93
-
94
-
95
-
96
-
97
-
98
-
99
-
100
-
101
-
102
-
103
-
104
-
105
-
106
-
107
-
108
-
109
-
110
-
111
-
112
-
113
-
114
-
115
-
116
-
117
-
118
-
119
-
120
-
121
-
122
-
123
-
124
-
125
-
126
-
127
-
128
-
129
-
130
-
131
-
132
-
133
-
134
-
135
-
136
-
137
-
138
-
139
-
140
-
141
-
142
-
143
-
144
-
145
-
146
-
147
-
148
-
149
-
150
-
151
-
152
-
153
-
154
-
155
-
156
-
157
-
158
-
159
-
160
-
161
-
162
-
163
-
 164
164 -
 165
165 -
 166
166 -
 167
167 -
 168
168 -
 169
169 -
 170
170 -
 171
171 -
 172
172 -
 173
173 -
 174
174 -
 175
175 -
 176
176 -
 177
177 -
 178
178 -
 179
179 -
 180
180 -
 181
181 -
 182
182 -
 183
183 -
 184
184 -
185
-
186
-
187
-
188
-
189
-
190
-
191
-
192
-
193
-
194
-
195
-
196
-
197
-
198
-
199
-
200
-
201
-
202
-
203
-
204
-
205
-
206
-
207
-
208
-
209
-
210
-
211
-
212
-
213
-
214
-
215
-
216
-
217
-
218
-
219
-
220
-
221
-
222
-
223
-
224
-
225
-
226
-
227
-
228
-
229
-
230
-
231
-
232
-
233
-
234
-
235
-
236
-
237
-
238
-
239
-
240
-
241
-
242
-
243
-
244
-
245
-
246
-
247
-
248
-
249
-
250
-
251
-
252
-
253
-
254
-
255
-
256
-
257
-
258
-
259
-
260
-
261
-
262
-
263
-
264
-
265
-
266
-
267
-
268
-
269
-
270
-
271
-
272
-
273
-
274
-
275
-
276
-
277
-
278
-
279
-
280
-
281
-
282
-
283
-
284
-
285
-
286
-
287
-
288
-
289
-
290
 |
 |

GENERAL MOTORS COMPANY AND SUBSIDIARIES
NOTES TO CONSOLIDATED FINANCIAL STATEMENTS — (Continued)
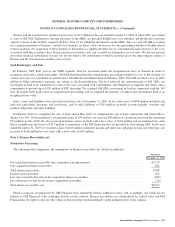
On July 10, 2009 our investments in SGM and its subsidiaries were adjusted to their fair values. Our investment in SGM was
increased by fresh-start reporting adjustments of $3.5 billion. This fair value adjustment of $3.5 billion was allocated as follows:
(1) goodwill of $2.9 billion; (2) intangible assets of $0.6 billion; and (3) property of $38 million. The increase in basis related to
intangible assets is being amortized on a straight-line basis over the remaining useful lives of the assets ranging from seven to 25
years, with amortization expense of $24 million per year. The increase in basis related to property is being depreciated on a straight-
line basis over the remaining useful lives of the assets ranging from two to 22 years, with depreciation expense of $5 million per year.
On July 10, 2009 our investment in SGMW was adjusted to its fair value. Our investment in SGMW was increased by fresh-start
reporting adjustments of $265 million which were allocated as follows: (1) goodwill of $165 million; (2) intangible assets of $93
million; and (3) property of $7 million. The increase in basis related to intangible assets is being amortized on a straight-line basis
over the remaining useful lives of 25 years, with amortization expense of $4 million per year. The increase in basis related to property
is being depreciated on a straight-line basis over the remaining useful lives of the assets ranging from three to 22 years.
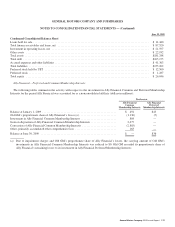
As a result of our purchase of an additional 10% interest in SGMW, our additional investment was recorded at its fair value of $394
million, an increase of $322 million from SGMW’s book value. This fair value increase was allocated as follows: (1) goodwill of
$231 million; (2) intangible assets of $82 million; (3) inventory of $5 million; and (4) property of $4 million. The increase in basis
related to intangible assets is being amortized on a straight-line basis over the remaining useful lives of 25 years, with amortization
expense of $3 million per year. The increase in basis related to property is being depreciated on a straight-line basis over the
remaining useful lives of the assets ranging from three to 22 years.
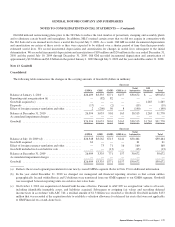
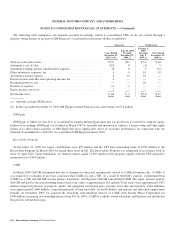
The following table presents summarized financial data for all of our nonconsolidated affiliates, excluding Ally Financial (dollars in
millions):
China JVs Others Total China JVs Others Total
December 31,
2010
December 31,
2010
December 31,
2010
December 31,
2009
December 31,
2009
December 31,
2009
Summarized Balance Sheet Data
Current assets ............................ $ 9,689 $ 9,708 $19,397 $ 6,954 $ 8,507 $15,461
Non-current assets ......................... 4,147 5,001 9,148 3,794 4,874 8,668
Total assets .............................. $13,836 $14,709 $28,545 $10,748 $13,381 $24,129
Current liabilities ......................... $ 8,931 $ 4,745 $13,676 $ 6,695 $ 4,608 $11,303
Non-current liabilities ...................... 580 2,232 2,812 302 1,905 2,207
Total liabilities ........................... $ 9,511 $ 6,977 $16,488 $ 6,997 $ 6,513 $13,510
Non-controlling interests ................... $ 766 $ 474 $ 1,240 $ 638 $ 440 $ 1,078
Year Ended
December 31, 2010 (a)
Year Ended
December 31, 2009 (b)
Year Ended
December 31, 2008
Summarized Operating Data
China JV’s net sales .......................................... $25,395 $18,098 $10,883
Others’ net sales ............................................. 17,500 7,457 10,415
Total net sales ............................................... $42,895 $25,555 $21,298
China JV’s net income ........................................ $ 2,808 $ 1,636 $ 671
Others’ net income ........................................... 656 161 (5,212)
Total net income ............................................. $ 3,464 $ 1,797 $ (4,541)
172 General Motors Company 2010 Annual Report