General Motors 2010 Annual Report Download - page 249
Download and view the complete annual report
Please find page 249 of the 2010 General Motors annual report below. You can navigate through the pages in the report by either clicking on the pages listed below, or by using the keyword search tool below to find specific information within the annual report.-
 1
1 -
2
-
3
-
4
-
5
-
6
-
7
-
8
-
9
-
10
-
11
-
12
-
13
-
14
-
15
-
16
-
17
-
18
-
19
-
20
-
21
-
22
-
23
-
24
-
25
-
26
-
27
-
28
-
29
-
30
-
31
-
32
-
33
-
34
-
35
-
36
-
37
-
38
-
39
-
40
-
41
-
42
-
43
-
44
-
45
-
46
-
47
-
48
-
49
-
50
-
51
-
52
-
53
-
54
-
55
-
56
-
57
-
58
-
59
-
60
-
61
-
62
-
63
-
64
-
65
-
66
-
67
-
68
-
69
-
70
-
71
-
72
-
73
-
74
-
75
-
76
-
77
-
78
-
79
-
80
-
81
-
82
-
83
-
84
-
85
-
86
-
87
-
88
-
89
-
90
-
91
-
92
-
93
-
94
-
95
-
96
-
97
-
98
-
99
-
100
-
101
-
102
-
103
-
104
-
105
-
106
-
107
-
108
-
109
-
110
-
111
-
112
-
113
-
114
-
115
-
116
-
117
-
118
-
119
-
120
-
121
-
122
-
123
-
124
-
125
-
126
-
127
-
128
-
129
-
130
-
131
-
132
-
133
-
134
-
135
-
136
-
137
-
138
-
139
-
140
-
141
-
142
-
143
-
144
-
145
-
146
-
147
-
148
-
149
-
150
-
151
-
152
-
153
-
154
-
155
-
156
-
157
-
158
-
159
-
160
-
161
-
162
-
163
-
164
-
165
-
166
-
167
-
168
-
169
-
170
-
171
-
172
-
173
-
174
-
175
-
176
-
177
-
178
-
179
-
180
-
181
-
182
-
183
-
184
-
185
-
186
-
187
-
188
-
189
-
190
-
191
-
192
-
193
-
194
-
195
-
196
-
197
-
198
-
199
-
200
-
201
-
202
-
203
-
204
-
205
-
206
-
207
-
208
-
209
-
210
-
211
-
212
-
213
-
214
-
215
-
216
-
217
-
218
-
219
-
220
-
221
-
222
-
223
-
224
-
225
-
226
-
227
-
228
-
229
-
230
-
231
-
232
-
233
-
234
-
235
-
236
-
237
-
238
-
 239
239 -
 240
240 -
 241
241 -
 242
242 -
 243
243 -
 244
244 -
 245
245 -
 246
246 -
 247
247 -
 248
248 -
 249
249 -
 250
250 -
 251
251 -
 252
252 -
 253
253 -
 254
254 -
 255
255 -
 256
256 -
 257
257 -
 258
258 -
 259
259 -
260
-
261
-
262
-
263
-
264
-
265
-
266
-
267
-
268
-
269
-
270
-
271
-
272
-
273
-
274
-
275
-
276
-
277
-
278
-
279
-
280
-
281
-
282
-
283
-
284
-
285
-
286
-
287
-
288
-
289
-
290
 |
 |

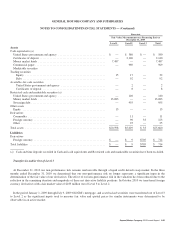
GENERAL MOTORS COMPANY AND SUBSIDIARIES
NOTES TO CONSOLIDATED FINANCIAL STATEMENTS — (Continued)
Predecessor
Level 3 Financial Assets and (Liabilities)
Mortgage-
backed
Securities
Commodity
Derivatives,
Net
Foreign
Currency
Derivatives
Other
Derivative
Instruments
Other
Securities
Total Net
Assets
(Liabilities)
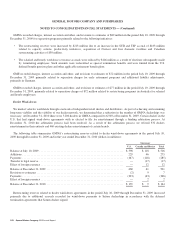
Balance at January 1, 2009 ............................ $49 $(17) $(2,144) $(164) $17 $(2,259)
Total realized/unrealized gains (losses)
Included in earnings ............................... (2) 13 26 164 (5) 196
Included in other comprehensive income (loss) .......... — — (2) — — (2)
Purchases, issuances and settlements .................... (14) 4 105 — (7) 88
Transfer in and/or out of Level 3 ....................... (33) — 585 — (5) 547
Balance at July 9, 2009 ............................... $— $— $(1,430) $ — $— $(1,430)
Amount of total gains and (losses) in the period included in
earnings attributable to the change in unrealized gains or
(losses) relating to assets still held at the reporting date .... $— $— $ 28 $ — $— $ 28
Short-Term and Long-Term Debt
We determined the fair value of debt based on a discounted cash flow model which used benchmark yield curves plus a spread that
represented the yields on traded bonds of companies with comparable credit ratings and risk profiles.
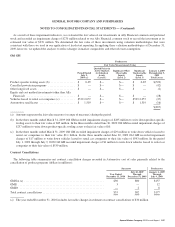
The following table summarizes the carrying amount and estimated fair values of short-term and long-term debt (dollars in
millions):
Successor
December 31, 2010 December 31, 2009
Carrying amount (a) ............................................................. $4,630 $15,783
Fair value (a) ................................................................... $4,840 $16,024
(a) Accounts and notes receivable, net and Accounts payable (principally trade) are not included because the carrying amount
approximates fair value due to their short-term nature.
Ally Financial Common and Preferred Stock
At December 31, 2010 we estimated the fair value of Ally Financial common stock using a market approach that applies the
average price to tangible book value multiples of comparable companies to the consolidated Ally Financial tangible book value. This
approach provides our best estimate of the fair value of our investment in Ally Financial common stock at December 31, 2010 due to
Ally Financial’s transition to a bank holding company and less readily available information with which to value Ally Financial’s
business operations individually. The significant inputs used in our fair value analysis were Ally Financial’s December 31, 2010
financial statements, as well as the financial statements and price to tangible book value multiples of comparable companies in the
banking and finance industry.
At December 31, 2009 we estimated the fair value of our investment in Ally Financial common stock using a market approach
based on the average price to tangible book value multiples of comparable companies to each of Ally Financial’s Auto Finance,
Commercial Finance, Mortgage, and Insurance operations to determine the fair value of the individual operations. These values were
aggregated to estimate the fair value of Ally Financial’s common stock. The significant inputs used to determine the appropriate
multiple for Ally Financial and used in our analysis were as follows:
• Ally Financial’s December 31, 2009 financial statements, as well as the financial statements and price to tangible book value
multiples of comparable companies in the Auto Finance, Commercial Finance and Insurance industries;
• Historical segment equity information separately provided by Ally Financial;
General Motors Company 2010 Annual Report 247