General Motors 2010 Annual Report Download - page 217
Download and view the complete annual report
Please find page 217 of the 2010 General Motors annual report below. You can navigate through the pages in the report by either clicking on the pages listed below, or by using the keyword search tool below to find specific information within the annual report.-
 1
1 -
2
-
3
-
4
-
5
-
6
-
7
-
8
-
9
-
10
-
11
-
12
-
13
-
14
-
15
-
16
-
17
-
18
-
19
-
20
-
21
-
22
-
23
-
24
-
25
-
26
-
27
-
28
-
29
-
30
-
31
-
32
-
33
-
34
-
35
-
36
-
37
-
38
-
39
-
40
-
41
-
42
-
43
-
44
-
45
-
46
-
47
-
48
-
49
-
50
-
51
-
52
-
53
-
54
-
55
-
56
-
57
-
58
-
59
-
60
-
61
-
62
-
63
-
64
-
65
-
66
-
67
-
68
-
69
-
70
-
71
-
72
-
73
-
74
-
75
-
76
-
77
-
78
-
79
-
80
-
81
-
82
-
83
-
84
-
85
-
86
-
87
-
88
-
89
-
90
-
91
-
92
-
93
-
94
-
95
-
96
-
97
-
98
-
99
-
100
-
101
-
102
-
103
-
104
-
105
-
106
-
107
-
108
-
109
-
110
-
111
-
112
-
113
-
114
-
115
-
116
-
117
-
118
-
119
-
120
-
121
-
122
-
123
-
124
-
125
-
126
-
127
-
128
-
129
-
130
-
131
-
132
-
133
-
134
-
135
-
136
-
137
-
138
-
139
-
140
-
141
-
142
-
143
-
144
-
145
-
146
-
147
-
148
-
149
-
150
-
151
-
152
-
153
-
154
-
155
-
156
-
157
-
158
-
159
-
160
-
161
-
162
-
163
-
164
-
165
-
166
-
167
-
168
-
169
-
170
-
171
-
172
-
173
-
174
-
175
-
176
-
177
-
178
-
179
-
180
-
181
-
182
-
183
-
184
-
185
-
186
-
187
-
188
-
189
-
190
-
191
-
192
-
193
-
194
-
195
-
196
-
197
-
198
-
199
-
200
-
201
-
202
-
203
-
204
-
205
-
206
-
 207
207 -
 208
208 -
 209
209 -
 210
210 -
 211
211 -
 212
212 -
 213
213 -
 214
214 -
 215
215 -
 216
216 -
 217
217 -
 218
218 -
 219
219 -
 220
220 -
 221
221 -
 222
222 -
 223
223 -
 224
224 -
 225
225 -
 226
226 -
 227
227 -
228
-
229
-
230
-
231
-
232
-
233
-
234
-
235
-
236
-
237
-
238
-
239
-
240
-
241
-
242
-
243
-
244
-
245
-
246
-
247
-
248
-
249
-
250
-
251
-
252
-
253
-
254
-
255
-
256
-
257
-
258
-
259
-
260
-
261
-
262
-
263
-
264
-
265
-
266
-
267
-
268
-
269
-
270
-
271
-
272
-
273
-
274
-
275
-
276
-
277
-
278
-
279
-
280
-
281
-
282
-
283
-
284
-
285
-
286
-
287
-
288
-
289
-
290
 |
 |

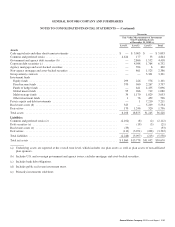
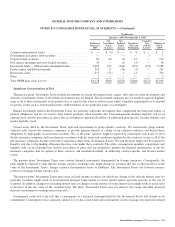
GENERAL MOTORS COMPANY AND SUBSIDIARIES
NOTES TO CONSOLIDATED FINANCIAL STATEMENTS — (Continued)
Successor
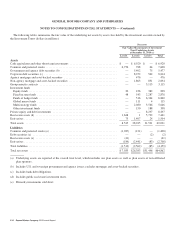
Fair Value Measurements of Investment
Trust Underlying Assets
at December 31, 2009 (a)
Level 1 Level 2 Level 3 Total
Assets
Cash equivalents and other short-term investments ................................. $ — $ 5,003 $ — $ 5,003
Common and preferred stocks .................................................. 4,614 177 53 4,844
Government and agency debt securities (b) ....................................... — 2,866 1,552 4,418
Corporate debt securities (c) ................................................... — 4,988 1,764 6,752
Agency mortgage and asset-backed securities ..................................... — 394 6 400
Non-agency mortgage and asset-backed securities .................................. — 861 1,525 2,386
Group annuity contracts ...................................................... — — 3,301 3,301
Investment funds
Equity funds .............................................................. 299 226 576 1,101
Fixed income funds ........................................................ 570 960 2,267 3,797
Funds of hedge funds ....................................................... — 641 4,455 5,096
Global macro funds ........................................................ 95 266 719 1,080
Multi-strategy funds ....................................................... 34 1,170 1,829 3,033
Other investment funds ..................................................... 1 76 459 536
Private equity and debt investments ............................................. — 1 7,210 7,211
Real estate assets (d) ......................................................... 325 — 5,209 5,534
Derivatives ................................................................. 170 1,246 320 1,736
Total assets ................................................................ 6,108 18,875 31,245 56,228
Liabilities
Common and preferred stocks (e) ............................................... (2,102) (8) (2) (2,112)
Debt securities (e) ........................................................... — (18) (3) (21)
Real estate assets (e) ......................................................... (33) — — (33)
Derivatives ................................................................. (113) (3,071) (208) (3,392)
Total liabilities .............................................................. (2,248) (3,097) (213) (5,558)
Total net assets ............................................................. $3,860 $15,778 $31,032 $50,670
(a) Underlying assets are reported at the overall trust level, which includes our plan assets as well as plan assets of non-affiliated
plan sponsors.
(b) Includes U.S. and sovereign government and agency issues; excludes mortgage and asset-backed securities.
(c) Includes bank debt obligations.
(d) Includes public real estate investment trusts.
(e) Primarily investments sold short.
General Motors Company 2010 Annual Report 215