General Motors 2010 Annual Report Download - page 48
Download and view the complete annual report
Please find page 48 of the 2010 General Motors annual report below. You can navigate through the pages in the report by either clicking on the pages listed below, or by using the keyword search tool below to find specific information within the annual report.-
 1
1 -
2
-
3
-
4
-
5
-
6
-
7
-
8
-
9
-
10
-
11
-
12
-
13
-
14
-
15
-
16
-
17
-
18
-
19
-
20
-
21
-
22
-
23
-
24
-
25
-
26
-
27
-
28
-
29
-
30
-
31
-
32
-
33
-
34
-
35
-
36
-
37
-
 38
38 -
 39
39 -
 40
40 -
 41
41 -
 42
42 -
 43
43 -
 44
44 -
 45
45 -
 46
46 -
 47
47 -
 48
48 -
 49
49 -
 50
50 -
 51
51 -
 52
52 -
 53
53 -
 54
54 -
 55
55 -
 56
56 -
 57
57 -
 58
58 -
59
-
60
-
61
-
62
-
63
-
64
-
65
-
66
-
67
-
68
-
69
-
70
-
71
-
72
-
73
-
74
-
75
-
76
-
77
-
78
-
79
-
80
-
81
-
82
-
83
-
84
-
85
-
86
-
87
-
88
-
89
-
90
-
91
-
92
-
93
-
94
-
95
-
96
-
97
-
98
-
99
-
100
-
101
-
102
-
103
-
104
-
105
-
106
-
107
-
108
-
109
-
110
-
111
-
112
-
113
-
114
-
115
-
116
-
117
-
118
-
119
-
120
-
121
-
122
-
123
-
124
-
125
-
126
-
127
-
128
-
129
-
130
-
131
-
132
-
133
-
134
-
135
-
136
-
137
-
138
-
139
-
140
-
141
-
142
-
143
-
144
-
145
-
146
-
147
-
148
-
149
-
150
-
151
-
152
-
153
-
154
-
155
-
156
-
157
-
158
-
159
-
160
-
161
-
162
-
163
-
164
-
165
-
166
-
167
-
168
-
169
-
170
-
171
-
172
-
173
-
174
-
175
-
176
-
177
-
178
-
179
-
180
-
181
-
182
-
183
-
184
-
185
-
186
-
187
-
188
-
189
-
190
-
191
-
192
-
193
-
194
-
195
-
196
-
197
-
198
-
199
-
200
-
201
-
202
-
203
-
204
-
205
-
206
-
207
-
208
-
209
-
210
-
211
-
212
-
213
-
214
-
215
-
216
-
217
-
218
-
219
-
220
-
221
-
222
-
223
-
224
-
225
-
226
-
227
-
228
-
229
-
230
-
231
-
232
-
233
-
234
-
235
-
236
-
237
-
238
-
239
-
240
-
241
-
242
-
243
-
244
-
245
-
246
-
247
-
248
-
249
-
250
-
251
-
252
-
253
-
254
-
255
-
256
-
257
-
258
-
259
-
260
-
261
-
262
-
263
-
264
-
265
-
266
-
267
-
268
-
269
-
270
-
271
-
272
-
273
-
274
-
275
-
276
-
277
-
278
-
279
-
280
-
281
-
282
-
283
-
284
-
285
-
286
-
287
-
288
-
289
-
290
 |
 |

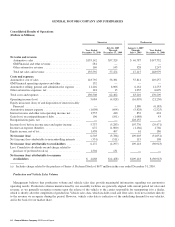
GENERAL MOTORS COMPANY AND SUBSIDIARIES
Reconciliation of Consolidated, Automotive and GM Financial Segment Results
Management believes EBIT provides meaningful supplemental information regarding our automotive segments’ operating results
because it excludes amounts that management does not consider part of operating results when assessing and measuring the
operational and financial performance of the organization. Management believes these measures allow it to readily view operating
trends, perform analytical comparisons and benchmark performance between periods and among geographic regions. We believe
EBIT is useful in allowing for greater transparency of our core operations and it is therefore used by management in its financial and
operational decision-making.
While management believes that EBIT provides useful information, it is not an operating measure under U.S. GAAP, and there are
limitations associated with its use. Our calculation of EBIT may not be completely comparable to similarly titled measures of other
companies due to potential differences between companies in the method of calculation. As a result, the use of EBIT has limitations
and should not be considered in isolation from, or as a substitute for, other measures such as Net income (loss) or Net income (loss)
attributable to common stockholders. Due to these limitations, EBIT is used as a supplement to U.S. GAAP measures.
Management believes income (loss) before income taxes provides meaningful supplemental information regarding GM Financial’s
operating results. GM Financial uses a separate measure from our automotive operations because management believes interest income
and interest expense are part of operating results when assessing and measuring the operational and financial performance of the segment.
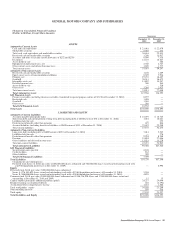
The following table summarizes the reconciliation of our automotive segments EBIT and GM Financial’s income before income
taxes to Net income (loss) attributable to stockholders (dollars in millions):
Successor Predecessor
Year Ended
December 31, 2010
July 10, 2009
Through
December 31, 2009
January 1, 2009
Through
July 9, 2009
Year Ended
December 31, 2008
Automotive
EBIT
GMNA (a) ............................ $5,748 81.4% $(4,820) 108.8% $ (11,092) 74.7% $(12,203) 85.3%
GME(a) ............................. (1,764) (25.0)% (814) 18.4% (2,815) 19.0% (2,625) 18.3%
GMIO (a) ............................ 2,262 32.0% 789 (17.8)% (486) 3.3% (555) 3.9%
GMSA (a) ............................ 818 11.6% 417 (9.4)% (454) 3.0% 1,076 (7.5)%
Total automotive EBIT .................. 7,064 100% (4,428) 100% (14,847) 100% (14,307) 100%
Corporate and eliminations (b) ............ 284 (359) 128,044 (13,000)
Interest income ........................ 465 184 183 655
Automotive interest expense ............. 1,098 694 5,428 2,525
Income tax expense (benefit) ............. 672 (1,000) (1,166) 1,766
Automotive Financing
GM Financial income before income taxes .... 129 — — —
Net income (loss) attributable to
stockholders .......................... $6,172 $(4,297) $109,118 $(30,943)
(a) Our automotive operations interest and income taxes are recorded centrally in Corporate; therefore, there are no reconciling items
for our automotive operating segments between EBIT and Net income (loss) attributable to stockholders.
(b) Includes Reorganization gains, net of $128.2 billion in the period January 1, 2009 through July 9, 2009.
46 General Motors Company 2010 Annual Report