General Motors 2010 Annual Report Download - page 61
Download and view the complete annual report
Please find page 61 of the 2010 General Motors annual report below. You can navigate through the pages in the report by either clicking on the pages listed below, or by using the keyword search tool below to find specific information within the annual report.-
 1
1 -
2
-
3
-
4
-
5
-
6
-
7
-
8
-
9
-
10
-
11
-
12
-
13
-
14
-
15
-
16
-
17
-
18
-
19
-
20
-
21
-
22
-
23
-
24
-
25
-
26
-
27
-
28
-
29
-
30
-
31
-
32
-
33
-
34
-
35
-
36
-
37
-
38
-
39
-
40
-
41
-
42
-
43
-
44
-
45
-
46
-
47
-
48
-
49
-
50
-
 51
51 -
 52
52 -
 53
53 -
 54
54 -
 55
55 -
 56
56 -
 57
57 -
 58
58 -
 59
59 -
 60
60 -
 61
61 -
 62
62 -
 63
63 -
 64
64 -
 65
65 -
 66
66 -
 67
67 -
 68
68 -
 69
69 -
 70
70 -
 71
71 -
72
-
73
-
74
-
75
-
76
-
77
-
78
-
79
-
80
-
81
-
82
-
83
-
84
-
85
-
86
-
87
-
88
-
89
-
90
-
91
-
92
-
93
-
94
-
95
-
96
-
97
-
98
-
99
-
100
-
101
-
102
-
103
-
104
-
105
-
106
-
107
-
108
-
109
-
110
-
111
-
112
-
113
-
114
-
115
-
116
-
117
-
118
-
119
-
120
-
121
-
122
-
123
-
124
-
125
-
126
-
127
-
128
-
129
-
130
-
131
-
132
-
133
-
134
-
135
-
136
-
137
-
138
-
139
-
140
-
141
-
142
-
143
-
144
-
145
-
146
-
147
-
148
-
149
-
150
-
151
-
152
-
153
-
154
-
155
-
156
-
157
-
158
-
159
-
160
-
161
-
162
-
163
-
164
-
165
-
166
-
167
-
168
-
169
-
170
-
171
-
172
-
173
-
174
-
175
-
176
-
177
-
178
-
179
-
180
-
181
-
182
-
183
-
184
-
185
-
186
-
187
-
188
-
189
-
190
-
191
-
192
-
193
-
194
-
195
-
196
-
197
-
198
-
199
-
200
-
201
-
202
-
203
-
204
-
205
-
206
-
207
-
208
-
209
-
210
-
211
-
212
-
213
-
214
-
215
-
216
-
217
-
218
-
219
-
220
-
221
-
222
-
223
-
224
-
225
-
226
-
227
-
228
-
229
-
230
-
231
-
232
-
233
-
234
-
235
-
236
-
237
-
238
-
239
-
240
-
241
-
242
-
243
-
244
-
245
-
246
-
247
-
248
-
249
-
250
-
251
-
252
-
253
-
254
-
255
-
256
-
257
-
258
-
259
-
260
-
261
-
262
-
263
-
264
-
265
-
266
-
267
-
268
-
269
-
270
-
271
-
272
-
273
-
274
-
275
-
276
-
277
-
278
-
279
-
280
-
281
-
282
-
283
-
284
-
285
-
286
-
287
-
288
-
289
-
290
 |
 |

GENERAL MOTORS COMPANY AND SUBSIDIARIES
(a) Vehicle sales primarily represent sales to the ultimate customer.
(b) Includes HUMMER, Saturn and Pontiac vehicle sales data.
(c) Our vehicle sales include Saab data through February 2010.
(d) Vehicle sales data may include rounding differences.
(e) Certain fleet sales that are accounted for as operating leases are included in vehicle sales at time of delivery to the daily rental car
companies.
GM
Combined GM
and Old GM Old GM
Year Ended
December 31,
2010
Year Ended
December 31,
2009
Year Ended
December 31,
2008
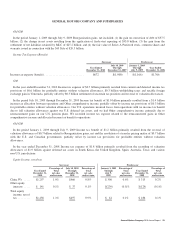
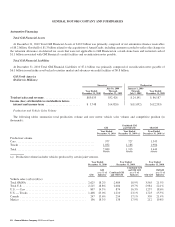
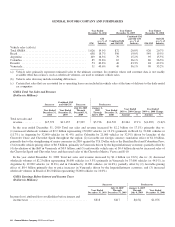
GMNA vehicle sales by brand (a)(b)(c)(d)(e)
Buick .................................................................... 168 111 154
Cadillac .................................................................. 156 115 170
Chevrolet ................................................................. 1,866 1,601 2,158
GMC .................................................................... 411 317 438
Other — Opel ............................................................. 1 1 2
Total core brands ....................................................... 2,602 2,145 2,922
HUMMER ................................................................ 4 11 30
Pontiac ................................................................... 12 238 383
Saab ..................................................................... 1 10 23
Saturn ................................................................... 7 81 207
Total other brands ...................................................... 24 339 643
GMNA total .............................................................. 2,625 2,484 3,565
(a) Vehicle sales primarily represent sales to the ultimate customer.
(b) Includes HUMMER, Saturn and Pontiac vehicle sales data.
(c) Our vehicle sales include Saab data through February 2010.
(d) Vehicle sales data may include rounding differences.
(e) Certain fleet sales that are accounted for as operating leases are included in vehicle sales at the time of delivery to the daily rental
car companies.
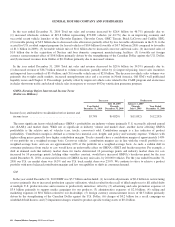
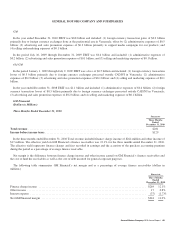
GMNA Total Net Sales and Revenue
(Dollars in Millions)
Successor
Combined GM
and Old GM Successor Predecessor
Year Ended
December 31,
2010
Year Ended
December 31,
2009
July 10, 2009
Through
December 31,
2009
January 1,
2009
Through
July 9, 2009
Year Ended
December 31,
2008
Year Ended
2010 vs. 2009
Change
Year Ended
2009 vs. 2008
Change
Amount % Amount %
Total net sales and
revenue ............ $83,035 $56,617 $32,426 $24,191 $86,187 $26,418 46.7% $(29,570) (34.3)%
General Motors Company 2010 Annual Report 59