General Motors 2010 Annual Report Download - page 50
Download and view the complete annual report
Please find page 50 of the 2010 General Motors annual report below. You can navigate through the pages in the report by either clicking on the pages listed below, or by using the keyword search tool below to find specific information within the annual report.-
 1
1 -
2
-
3
-
4
-
5
-
6
-
7
-
8
-
9
-
10
-
11
-
12
-
13
-
14
-
15
-
16
-
17
-
18
-
19
-
20
-
21
-
22
-
23
-
24
-
25
-
26
-
27
-
28
-
29
-
30
-
31
-
32
-
33
-
34
-
35
-
36
-
37
-
38
-
39
-
 40
40 -
 41
41 -
 42
42 -
 43
43 -
 44
44 -
 45
45 -
 46
46 -
 47
47 -
 48
48 -
 49
49 -
 50
50 -
 51
51 -
 52
52 -
 53
53 -
 54
54 -
 55
55 -
 56
56 -
 57
57 -
 58
58 -
 59
59 -
 60
60 -
61
-
62
-
63
-
64
-
65
-
66
-
67
-
68
-
69
-
70
-
71
-
72
-
73
-
74
-
75
-
76
-
77
-
78
-
79
-
80
-
81
-
82
-
83
-
84
-
85
-
86
-
87
-
88
-
89
-
90
-
91
-
92
-
93
-
94
-
95
-
96
-
97
-
98
-
99
-
100
-
101
-
102
-
103
-
104
-
105
-
106
-
107
-
108
-
109
-
110
-
111
-
112
-
113
-
114
-
115
-
116
-
117
-
118
-
119
-
120
-
121
-
122
-
123
-
124
-
125
-
126
-
127
-
128
-
129
-
130
-
131
-
132
-
133
-
134
-
135
-
136
-
137
-
138
-
139
-
140
-
141
-
142
-
143
-
144
-
145
-
146
-
147
-
148
-
149
-
150
-
151
-
152
-
153
-
154
-
155
-
156
-
157
-
158
-
159
-
160
-
161
-
162
-
163
-
164
-
165
-
166
-
167
-
168
-
169
-
170
-
171
-
172
-
173
-
174
-
175
-
176
-
177
-
178
-
179
-
180
-
181
-
182
-
183
-
184
-
185
-
186
-
187
-
188
-
189
-
190
-
191
-
192
-
193
-
194
-
195
-
196
-
197
-
198
-
199
-
200
-
201
-
202
-
203
-
204
-
205
-
206
-
207
-
208
-
209
-
210
-
211
-
212
-
213
-
214
-
215
-
216
-
217
-
218
-
219
-
220
-
221
-
222
-
223
-
224
-
225
-
226
-
227
-
228
-
229
-
230
-
231
-
232
-
233
-
234
-
235
-
236
-
237
-
238
-
239
-
240
-
241
-
242
-
243
-
244
-
245
-
246
-
247
-
248
-
249
-
250
-
251
-
252
-
253
-
254
-
255
-
256
-
257
-
258
-
259
-
260
-
261
-
262
-
263
-
264
-
265
-
266
-
267
-
268
-
269
-
270
-
271
-
272
-
273
-
274
-
275
-
276
-
277
-
278
-
279
-
280
-
281
-
282
-
283
-
284
-
285
-
286
-
287
-
288
-
289
-
290
 |
 |

GENERAL MOTORS COMPANY AND SUBSIDIARIES
$1.3 billion in GME; (4) decreased derivative losses of $0.9 billion in GMIO; (5) favorable pricing of $0.4 billion in GMSA,
primarily due to a 60% price increase in Venezuela due to high inflation; and (6) favorable vehicle mix of $0.3 billion in GMIO
driven by launches of new vehicle models at GM Daewoo.
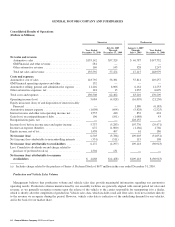
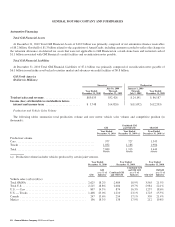
Automotive Cost of Sales
Successor Predecessor
Year Ended
December 31, 2010
Percentage of
Automotives
sales
July 10, 2009
Through
December 31, 2009
Percentage of
Automotive
sales
January 1, 2009
Through
July 9, 2009
Percentage of
Automotive
sales
Year Ended
December 31, 2008
Percentage of
Automotive
sales
Automotive cost
of sales ...... $118,792 87.9% $56,381 98.3% $55,814 119.3% $149,257 101.0%
Automotive gross
margin ...... $ 16,350 12.1% $ 948 1.7% $ (9,027) (19.3)% $ (1,525) (1.0)%
GM
In the year ended December 31, 2010 Automotive cost of sales included: (1) restructuring charges of $0.8 billion in GME primarily
for separation programs announced in Belgium, Spain, Germany and the United Kingdom; (2) foreign currency remeasurement losses
of $0.5 billion in GMNA; (3) charges of $0.2 billion for a recall campaign on windshield fluid heaters in GMNA; (4) impairment
charges related to product-specific tooling assets of $0.2 billion in GMNA; partially offset by (5) favorable adjustments of $0.4 billion
to restructuring reserves primarily due to increased production capacity utilization in GMNA; and (6) foreign currency transaction
gains of $0.3 billion in GMSA.
In the period July 10, 2009 through December 31, 2009 Automotive cost of sales included: (1) a settlement loss of $2.6 billion
related to the termination of the UAW hourly retiree medical plan and Mitigation Plan in GMNA; (2) foreign currency remeasurement
losses of $1.3 billion in GMNA; partially offset by (3) favorable adjustments of $0.7 billion in GMNA, $0.5 billion in GME and $0.1
billion in GMIO due to the sell through of inventory acquired from Old GM at July 10, 2009; and (4) foreign currency transaction
gains of $0.5 billion primarily in Corporate.
Old GM
In the period January 1, 2009 through July 9, 2009 Automotive cost of sales included: (1) incremental depreciation charges of $2.1
billion in GMNA and $0.7 billion in GME; (2) a curtailment loss of $1.4 billion upon the interim remeasurement of the U.S. hourly
defined benefit pension plans in GMNA; (3) separation program charges and Canadian restructuring activities of $1.1 billion in
GMNA; (4) charges of $0.8 billion primarily related to the deconsolidation of Saab; (5) foreign currency translation and
remeasurement losses of $0.7 billion in GMNA; (6) impairment charges of $0.4 billion in GMNA and $0.2 billion in GME primarily
for product-specific tooling; (7) foreign currency transaction losses of $0.5 billion in GMSA; (8) derivative losses of $0.5 billion
related to commodity and foreign currency exchange derivatives in GMNA; (9) a charge of $1.1 billion related to the Supplemental
Unemployment Benefit (SUB) and the Transitional Support Program (TSP), partially offset by a favorable adjustment of $0.7 billion
primarily related to the suspension of the JOBS Program, Old GM’s job security provision of the collective bargaining agreement with
the UAW to continue paying idled employees certain wages and benefits in GMNA; and (10) charges of $0.3 billion related to
obligations associated with various Delphi agreements in GMNA.
In the period January 1, 2009 through July 9, 2009 negative gross margin reflected sales volumes at historically low levels and
Automotive cost of sales, including costs that are fixed in nature, exceeding Total net sales and revenue.
In the year ended December 31, 2008 Automotive cost of sales included: (1) restructuring charges and other costs of $6.0 billion
related to Old GM’s special attrition programs in GMNA; (2) expenses of $1.7 billion related to the salaried post-65 healthcare
settlement in GMNA; (3) impairment charges of $0.5 billion in GME and $0.4 billion in GMNA primarily related to product-specific
tooling; (4) commodity and foreign currency exchange derivative losses of $0.8 billion in GMNA; (5) charges of $0.3 billion
48 General Motors Company 2010 Annual Report