General Motors 2010 Annual Report Download - page 97
Download and view the complete annual report
Please find page 97 of the 2010 General Motors annual report below. You can navigate through the pages in the report by either clicking on the pages listed below, or by using the keyword search tool below to find specific information within the annual report.-
 1
1 -
2
-
3
-
4
-
5
-
6
-
7
-
8
-
9
-
10
-
11
-
12
-
13
-
14
-
15
-
16
-
17
-
18
-
19
-
20
-
21
-
22
-
23
-
24
-
25
-
26
-
27
-
28
-
29
-
30
-
31
-
32
-
33
-
34
-
35
-
36
-
37
-
38
-
39
-
40
-
41
-
42
-
43
-
44
-
45
-
46
-
47
-
48
-
49
-
50
-
51
-
52
-
53
-
54
-
55
-
56
-
57
-
58
-
59
-
60
-
61
-
62
-
63
-
64
-
65
-
66
-
67
-
68
-
69
-
70
-
71
-
72
-
73
-
74
-
75
-
76
-
77
-
78
-
79
-
80
-
81
-
82
-
83
-
84
-
85
-
86
-
 87
87 -
 88
88 -
 89
89 -
 90
90 -
 91
91 -
 92
92 -
 93
93 -
 94
94 -
 95
95 -
 96
96 -
 97
97 -
 98
98 -
 99
99 -
 100
100 -
 101
101 -
 102
102 -
 103
103 -
 104
104 -
 105
105 -
 106
106 -
 107
107 -
108
-
109
-
110
-
111
-
112
-
113
-
114
-
115
-
116
-
117
-
118
-
119
-
120
-
121
-
122
-
123
-
124
-
125
-
126
-
127
-
128
-
129
-
130
-
131
-
132
-
133
-
134
-
135
-
136
-
137
-
138
-
139
-
140
-
141
-
142
-
143
-
144
-
145
-
146
-
147
-
148
-
149
-
150
-
151
-
152
-
153
-
154
-
155
-
156
-
157
-
158
-
159
-
160
-
161
-
162
-
163
-
164
-
165
-
166
-
167
-
168
-
169
-
170
-
171
-
172
-
173
-
174
-
175
-
176
-
177
-
178
-
179
-
180
-
181
-
182
-
183
-
184
-
185
-
186
-
187
-
188
-
189
-
190
-
191
-
192
-
193
-
194
-
195
-
196
-
197
-
198
-
199
-
200
-
201
-
202
-
203
-
204
-
205
-
206
-
207
-
208
-
209
-
210
-
211
-
212
-
213
-
214
-
215
-
216
-
217
-
218
-
219
-
220
-
221
-
222
-
223
-
224
-
225
-
226
-
227
-
228
-
229
-
230
-
231
-
232
-
233
-
234
-
235
-
236
-
237
-
238
-
239
-
240
-
241
-
242
-
243
-
244
-
245
-
246
-
247
-
248
-
249
-
250
-
251
-
252
-
253
-
254
-
255
-
256
-
257
-
258
-
259
-
260
-
261
-
262
-
263
-
264
-
265
-
266
-
267
-
268
-
269
-
270
-
271
-
272
-
273
-
274
-
275
-
276
-
277
-
278
-
279
-
280
-
281
-
282
-
283
-
284
-
285
-
286
-
287
-
288
-
289
-
290
 |
 |

GENERAL MOTORS COMPANY AND SUBSIDIARIES
Our estimate of reorganization value assumes the achievement of the future financial results contemplated in our forecasted cash
flows, and there can be no assurance that we will realize that value. The estimates and assumptions used are subject to significant
uncertainties, many of which are beyond our control, and there is no assurance that anticipated financial results will be achieved.
Assumptions used in our discounted cash flow analysis that have the most significant effect on our estimated reorganization value
include:
• Our estimated WACC;
• Our estimated long-term growth rates; and
• Our estimate of industry sales and our market share in each of Old GM’s former segments.
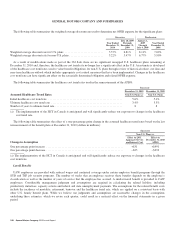
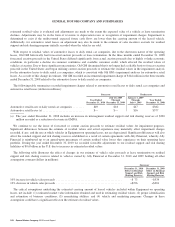
The following table reconciles our enterprise value to our estimated reorganization value and the estimated fair value of our Equity
(in millions except per share amounts):
Successor
July 10, 2009
Enterprise value ................................................................................... $ 36,747
Plus: Fair value of operating liabilities (a) ............................................................... 80,832
Estimated reorganization value (fair value of assets) (b) 117,579
Adjustments to tax and employee benefit-related assets (c) .................................................. (6,074)
Goodwill (c) ...................................................................................... 30,464
Carrying amount of assets ............................................................................ $141,969
Enterprise value ................................................................................... $ 36,747
Less: Fair value of debt .............................................................................. (15,694)
Less: Fair value of warrants issued to MLC (additional paid-in-capital) ........................................ (2,405)
Less: Fair value of liability for Adjustment Shares ........................................................ (113)
Less: Fair value of noncontrolling interests .............................................................. (408)
Less: Fair value of Series A Preferred Stock (d) .......................................................... (1,741)
Fair value of common equity (common stock and additional paid-in capital) .................................... $ 16,386
Common shares outstanding (d) ....................................................................... 1,238
Per share value .................................................................................... $ 13.24
(a) Operating liabilities are our total liabilities excluding the liabilities listed in the reconciliation above of our enterprise value to the
fair value of our common equity.
(b) Reorganization value does not include assets with a carrying amount of $1.8 billion and a fair value of $2.0 billion at July 9,
2009 that MLC retained.
(c) The application of fresh-start reporting resulted in the recognition of goodwill. When applying fresh-start reporting, certain
accounts, primarily employee benefit and income tax related, were recorded at amounts determined under specific U.S. GAAP
rather than at fair value and the difference between the U.S. GAAP and fair value amounts gives rise to goodwill, which is a
residual. Further, we recorded valuation allowances against certain of our deferred tax assets, which under ASC 852 also resulted
in goodwill. Our employee benefit related obligations were recorded in accordance with ASC 712, “Compensation —
Nonretirement Postemployment Benefits” (ASC 712) and ASC 715 and deferred income taxes were recorded in accordance with
ASC 740.
General Motors Company 2010 Annual Report 95