General Motors 2010 Annual Report Download - page 284
Download and view the complete annual report
Please find page 284 of the 2010 General Motors annual report below. You can navigate through the pages in the report by either clicking on the pages listed below, or by using the keyword search tool below to find specific information within the annual report.-
 1
1 -
2
-
3
-
4
-
5
-
6
-
7
-
8
-
9
-
10
-
11
-
12
-
13
-
14
-
15
-
16
-
17
-
18
-
19
-
20
-
21
-
22
-
23
-
24
-
25
-
26
-
27
-
28
-
29
-
30
-
31
-
32
-
33
-
34
-
35
-
36
-
37
-
38
-
39
-
40
-
41
-
42
-
43
-
44
-
45
-
46
-
47
-
48
-
49
-
50
-
51
-
52
-
53
-
54
-
55
-
56
-
57
-
58
-
59
-
60
-
61
-
62
-
63
-
64
-
65
-
66
-
67
-
68
-
69
-
70
-
71
-
72
-
73
-
74
-
75
-
76
-
77
-
78
-
79
-
80
-
81
-
82
-
83
-
84
-
85
-
86
-
87
-
88
-
89
-
90
-
91
-
92
-
93
-
94
-
95
-
96
-
97
-
98
-
99
-
100
-
101
-
102
-
103
-
104
-
105
-
106
-
107
-
108
-
109
-
110
-
111
-
112
-
113
-
114
-
115
-
116
-
117
-
118
-
119
-
120
-
121
-
122
-
123
-
124
-
125
-
126
-
127
-
128
-
129
-
130
-
131
-
132
-
133
-
134
-
135
-
136
-
137
-
138
-
139
-
140
-
141
-
142
-
143
-
144
-
145
-
146
-
147
-
148
-
149
-
150
-
151
-
152
-
153
-
154
-
155
-
156
-
157
-
158
-
159
-
160
-
161
-
162
-
163
-
164
-
165
-
166
-
167
-
168
-
169
-
170
-
171
-
172
-
173
-
174
-
175
-
176
-
177
-
178
-
179
-
180
-
181
-
182
-
183
-
184
-
185
-
186
-
187
-
188
-
189
-
190
-
191
-
192
-
193
-
194
-
195
-
196
-
197
-
198
-
199
-
200
-
201
-
202
-
203
-
204
-
205
-
206
-
207
-
208
-
209
-
210
-
211
-
212
-
213
-
214
-
215
-
216
-
217
-
218
-
219
-
220
-
221
-
222
-
223
-
224
-
225
-
226
-
227
-
228
-
229
-
230
-
231
-
232
-
233
-
234
-
235
-
236
-
237
-
238
-
239
-
240
-
241
-
242
-
243
-
244
-
245
-
246
-
247
-
248
-
249
-
250
-
251
-
252
-
253
-
254
-
255
-
256
-
257
-
258
-
259
-
260
-
261
-
262
-
263
-
264
-
265
-
266
-
267
-
268
-
269
-
270
-
271
-
272
-
273
-
 274
274 -
 275
275 -
 276
276 -
 277
277 -
 278
278 -
 279
279 -
 280
280 -
 281
281 -
 282
282 -
 283
283 -
 284
284 -
 285
285 -
 286
286 -
 287
287 -
 288
288 -
 289
289 -
 290
290
 |
 |

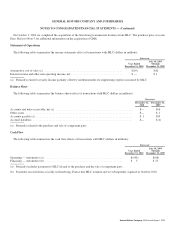
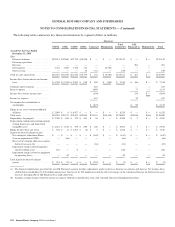
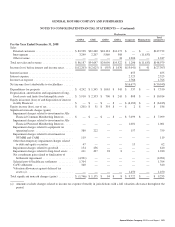
GENERAL MOTORS COMPANY AND SUBSIDIARIES
NOTES TO CONSOLIDATED FINANCIAL STATEMENTS — (Continued)
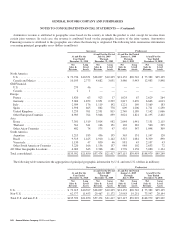
Automotive revenue is attributed to geographic areas based on the country in which the product is sold, except for revenue from
certain joint ventures. In such case, the revenue is attributed based on the geographic location of the joint venture. Automotive
Financing revenue is attributed to the geographic area where the financing is originated. The following table summarizes information
concerning principal geographic areas (dollars in millions):
Successor Predecessor
At and For the
Year Ended
December 31, 2010
At and For the Period
July 10, 2009
Through
December 31, 2009
At and For the Period
January 1, 2009
Through
July 9, 2009
At and For the
Year Ended
December 31, 2008
Net
Sales &
Revenue
Long
Lived
Assets
Net
Sales &
Revenue
Long
Lived
Assets
Net
Sales &
Revenue
Long
Lived
Assets
Net
Sales &
Revenue
Long
Lived
Assets
North America
U.S. ................................ $ 72,736 $10,351 $28,007 $10,245 $21,152 $20,742 $ 75,382 $25,105
Canada and Mexico ................... 10,195 2,773 4,682 3,031 3,486 5,943 12,983 5,898
GM Financial
U.S. ................................ 279 46———— ——
Canada .............................. 2 1———— ——
Europe
France .............................. 1,820 63 923 17 1,024 67 2,629 264
Germany ............................ 5,004 1,852 2,851 2,299 3,817 3,670 6,663 4,013
Italy ................................ 2,509 176 1,119 192 1,221 169 3,169 183
Spain ............................... 1,398 665 862 778 609 1,206 1,711 1,230
United Kingdom ...................... 5,253 761 2,531 815 2,749 1,189 7,142 1,066
Other European Countries .............. 6,905 764 3,046 839 3,024 1,821 11,195 2,402
Asia
Korea ............................... 7,301 1,519 3,014 982 2,044 1,941 7,131 2,115
Thailand ............................ 561 341 166 151 103 383 560 395
Other Asian Countries ................. 482 74 575 47 435 347 1,098 309
South America
Argentina ........................... 1,215 183 436 195 363 131 1,147 120
Brazil ............................... 9,513 1,425 4,910 1,142 3,347 1,081 8,329 890
Venezuela ........................... 1,130 47 850 46 981 43 2,107 43
Other South American Countries ......... 3,220 166 1,136 157 984 102 2,653 72
All Other Geographic Locations ............ 6,069 643 2,366 481 1,776 1,158 5,080 1,144
Total consolidated ....................... $135,592 $21,850 $57,474 $21,417 $47,115 $39,993 $148,979 $45,249
The following table summarizes the aggregation of principal geographic information by U.S. and non-U.S. (dollars in millions):
Successor Predecessor
At and For the
Year Ended
December 31, 2010
At and For the Period
July 10, 2009
Through
December 31, 2009
At and For the Period
January 1, 2009
Through
July 9, 2009
At and For the
Year Ended
December 31, 2008
Net
Sales &
Revenue
Long
Lived
Assets
Net
Sales &
Revenue
Long
Lived
Assets
Net
Sales &
Revenue
Long
Lived
Assets
Net
Sales &
Revenue
Long
Lived
Assets
U.S. .................................. $ 73,015 $10,397 $28,007 $10,245 $21,152 $20,742 $ 75,382 $25,105
Non-U.S. .............................. 62,577 11,453 29,467 11,172 25,963 19,251 73,597 20,144
Total U.S. and non-U.S. .................. $135,592 $21,850 $57,474 $21,417 $47,115 $39,993 $148,979 $45,249
282 General Motors Company 2010 Annual Report