General Motors 2010 Annual Report Download - page 52
Download and view the complete annual report
Please find page 52 of the 2010 General Motors annual report below. You can navigate through the pages in the report by either clicking on the pages listed below, or by using the keyword search tool below to find specific information within the annual report.-
 1
1 -
2
-
3
-
4
-
5
-
6
-
7
-
8
-
9
-
10
-
11
-
12
-
13
-
14
-
15
-
16
-
17
-
18
-
19
-
20
-
21
-
22
-
23
-
24
-
25
-
26
-
27
-
28
-
29
-
30
-
31
-
32
-
33
-
34
-
35
-
36
-
37
-
38
-
39
-
40
-
41
-
 42
42 -
 43
43 -
 44
44 -
 45
45 -
 46
46 -
 47
47 -
 48
48 -
 49
49 -
 50
50 -
 51
51 -
 52
52 -
 53
53 -
 54
54 -
 55
55 -
 56
56 -
 57
57 -
 58
58 -
 59
59 -
 60
60 -
 61
61 -
 62
62 -
63
-
64
-
65
-
66
-
67
-
68
-
69
-
70
-
71
-
72
-
73
-
74
-
75
-
76
-
77
-
78
-
79
-
80
-
81
-
82
-
83
-
84
-
85
-
86
-
87
-
88
-
89
-
90
-
91
-
92
-
93
-
94
-
95
-
96
-
97
-
98
-
99
-
100
-
101
-
102
-
103
-
104
-
105
-
106
-
107
-
108
-
109
-
110
-
111
-
112
-
113
-
114
-
115
-
116
-
117
-
118
-
119
-
120
-
121
-
122
-
123
-
124
-
125
-
126
-
127
-
128
-
129
-
130
-
131
-
132
-
133
-
134
-
135
-
136
-
137
-
138
-
139
-
140
-
141
-
142
-
143
-
144
-
145
-
146
-
147
-
148
-
149
-
150
-
151
-
152
-
153
-
154
-
155
-
156
-
157
-
158
-
159
-
160
-
161
-
162
-
163
-
164
-
165
-
166
-
167
-
168
-
169
-
170
-
171
-
172
-
173
-
174
-
175
-
176
-
177
-
178
-
179
-
180
-
181
-
182
-
183
-
184
-
185
-
186
-
187
-
188
-
189
-
190
-
191
-
192
-
193
-
194
-
195
-
196
-
197
-
198
-
199
-
200
-
201
-
202
-
203
-
204
-
205
-
206
-
207
-
208
-
209
-
210
-
211
-
212
-
213
-
214
-
215
-
216
-
217
-
218
-
219
-
220
-
221
-
222
-
223
-
224
-
225
-
226
-
227
-
228
-
229
-
230
-
231
-
232
-
233
-
234
-
235
-
236
-
237
-
238
-
239
-
240
-
241
-
242
-
243
-
244
-
245
-
246
-
247
-
248
-
249
-
250
-
251
-
252
-
253
-
254
-
255
-
256
-
257
-
258
-
259
-
260
-
261
-
262
-
263
-
264
-
265
-
266
-
267
-
268
-
269
-
270
-
271
-
272
-
273
-
274
-
275
-
276
-
277
-
278
-
279
-
280
-
281
-
282
-
283
-
284
-
285
-
286
-
287
-
288
-
289
-
290
 |
 |

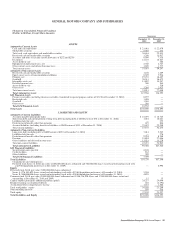
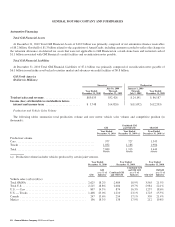
GENERAL MOTORS COMPANY AND SUBSIDIARIES
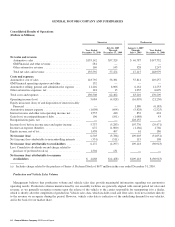
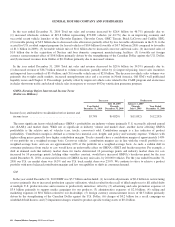
Other Automotive Expenses, net
Successor Predecessor
Year Ended
December 31,
2010
Percentage of
Total
net sales and
revenue
July 10, 2009
Through
December 31,
2009
Percentage of
Total
net sales and
revenue
January 1,
2009
Through
July 9,
2009
Percentage of
Total
net sales and
revenue
Year Ended
December 31,
2008
Percentage of
total
net sales
and revenue
Other automotive
expenses, net .... $118 0.1% $15 —% $1,235 2.6% $6,699 4.5%
GM
In the year ended December 31, 2010 Other automotive expenses, net included primarily depreciation expense of $0.1 billion
related to our portfolio of automotive retail leases.
In the period July 10, 2009 through December 31, 2009 Other automotive expenses, net included: (1) depreciation expense and
realized losses of $89 million related to the portfolio of automotive retail leases; (2) pension management expenses of $38 million;
(3) interest expense related to our dealer financing program of $13 million; partially offset by (3) gains in GME for changes in
liabilities related to Saab of $60 million; (4) recovery of amounts written off of $51 million related to the portfolio of automotive
retail leases; and (5) gain on sale of vehicles of $19 million related to the portfolio of automotive retail leases.
Old GM
In the period January 1, 2009 through July 9, 2009 Other automotive expenses, net included: (1) charges of $0.8 billion in GME,
primarily related to the deconsolidation of Saab; (2) charges of $0.2 billion related to Delphi; and (3) depreciation expense of
$0.1 billion related to the portfolio of automotive retail leases.
In the year ended December 31, 2008 Other automotive expenses, net included: (1) charges related to the Delphi Benefit Guarantee
Agreements of $4.8 billion; (2) depreciation expense of $0.7 billion related to the portfolio of automotive retail leases; (3) Goodwill
impairment charges of $0.6 billion; (4) operating expenses of $0.4 billion related to the portfolio of automotive retail leases; and
(5) interest expense of $0.1 billion.
Equity in Income (Loss) of and Disposition of Interest in Ally Financial
Predecessor
January 1,
2009
Through
July 9, 2009
Percentage of
Total
net sales
and revenue
Year Ended
December 31, 2008
Percentage of
Total
net sales
and revenue
Equity in income (loss) of and disposition of interest in Ally Financial .... $(1,097) (2.3)% $ 916 0.6%
Gain on conversion of UST Ally Financial Loan ..................... 2,477 5.3% — —%
Impairment charges related to Ally Financial Common Membership
Interests ................................................... — —% (7,099) (4.8)%
Total equity in income (loss) of and disposition of interest in Ally
Financial .................................................. $1,380 2.9% $(6,183) (4.2)%
Old GM
In the period January 1, 2009 through July 9, 2009 Equity in loss of and disposition of interest in Ally Financial included: (1) Gain
of $2.5 billion recorded on the UST’s conversion of the UST Ally Financial Loan for Class B Membership Interests in Ally Financial;
partially offset by (2) Old GM’s proportionate share of Ally Financial’s loss from operations on $1.1 billion.
50 General Motors Company 2010 Annual Report