General Motors 2010 Annual Report Download - page 73
Download and view the complete annual report
Please find page 73 of the 2010 General Motors annual report below. You can navigate through the pages in the report by either clicking on the pages listed below, or by using the keyword search tool below to find specific information within the annual report.-
 1
1 -
2
-
3
-
4
-
5
-
6
-
7
-
8
-
9
-
10
-
11
-
12
-
13
-
14
-
15
-
16
-
17
-
18
-
19
-
20
-
21
-
22
-
23
-
24
-
25
-
26
-
27
-
28
-
29
-
30
-
31
-
32
-
33
-
34
-
35
-
36
-
37
-
38
-
39
-
40
-
41
-
42
-
43
-
44
-
45
-
46
-
47
-
48
-
49
-
50
-
51
-
52
-
53
-
54
-
55
-
56
-
57
-
58
-
59
-
60
-
61
-
62
-
 63
63 -
 64
64 -
 65
65 -
 66
66 -
 67
67 -
 68
68 -
 69
69 -
 70
70 -
 71
71 -
 72
72 -
 73
73 -
 74
74 -
 75
75 -
 76
76 -
 77
77 -
 78
78 -
 79
79 -
 80
80 -
 81
81 -
 82
82 -
 83
83 -
84
-
85
-
86
-
87
-
88
-
89
-
90
-
91
-
92
-
93
-
94
-
95
-
96
-
97
-
98
-
99
-
100
-
101
-
102
-
103
-
104
-
105
-
106
-
107
-
108
-
109
-
110
-
111
-
112
-
113
-
114
-
115
-
116
-
117
-
118
-
119
-
120
-
121
-
122
-
123
-
124
-
125
-
126
-
127
-
128
-
129
-
130
-
131
-
132
-
133
-
134
-
135
-
136
-
137
-
138
-
139
-
140
-
141
-
142
-
143
-
144
-
145
-
146
-
147
-
148
-
149
-
150
-
151
-
152
-
153
-
154
-
155
-
156
-
157
-
158
-
159
-
160
-
161
-
162
-
163
-
164
-
165
-
166
-
167
-
168
-
169
-
170
-
171
-
172
-
173
-
174
-
175
-
176
-
177
-
178
-
179
-
180
-
181
-
182
-
183
-
184
-
185
-
186
-
187
-
188
-
189
-
190
-
191
-
192
-
193
-
194
-
195
-
196
-
197
-
198
-
199
-
200
-
201
-
202
-
203
-
204
-
205
-
206
-
207
-
208
-
209
-
210
-
211
-
212
-
213
-
214
-
215
-
216
-
217
-
218
-
219
-
220
-
221
-
222
-
223
-
224
-
225
-
226
-
227
-
228
-
229
-
230
-
231
-
232
-
233
-
234
-
235
-
236
-
237
-
238
-
239
-
240
-
241
-
242
-
243
-
244
-
245
-
246
-
247
-
248
-
249
-
250
-
251
-
252
-
253
-
254
-
255
-
256
-
257
-
258
-
259
-
260
-
261
-
262
-
263
-
264
-
265
-
266
-
267
-
268
-
269
-
270
-
271
-
272
-
273
-
274
-
275
-
276
-
277
-
278
-
279
-
280
-
281
-
282
-
283
-
284
-
285
-
286
-
287
-
288
-
289
-
290
 |
 |

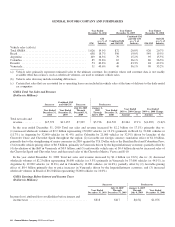
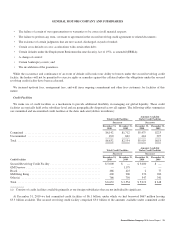
GENERAL MOTORS COMPANY AND SUBSIDIARIES
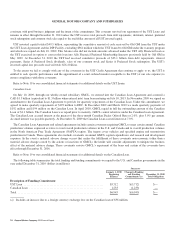
Corporate Net Income (Loss) Attributable to Stockholders
(Dollars in Millions)
Successor Predecessor
Year Ended
December 31, 2010
July 10, 2009
Through
December 31, 2009
January 1, 2009
Through
July 9, 2009
Year Ended
December 31, 2008
Net income (loss) attributable to stockholders ............ $(877) $176 $123,902 $(16,677)
GM
In the year ended December 31, 2010 results included: (1) Interest expense of $1.1 billion comprised of interest expense of $0.3
billion on the UST Loans, Canadian Loan and VEBA Notes, interest expense of $0.3 billion on GMNA debt, and interest expense of
$0.4 billion on GMIO and GMSA debt; (2) income tax expense of $0.6 billion primarily related to tax expense attributable to
profitable entities that do not have full valuation allowances recorded against deferred tax assets; (3) administrative expenses of $0.4
billion primarily related to consultants and services provided by outside companies; partially offset by (4) interest income of $0.4
billion earned primarily on marketable securities held in GMSA; (5) the reversal of our $0.2 billion liability for the Adjustment
Shares; (6) a gain on extinguishment of debt of $0.2 billion related to our repayment of the outstanding amount of VEBA Notes of
$2.8 billion; and (7) dividends of $0.1 billion on our investment in Ally Financial preferred stock.
In the period July 10, 2009 through December 31, 2009 results included: (1) foreign currency transaction gains of $0.3 billion due
to the appreciation of the Canadian Dollar versus the U.S. Dollar; and (2) interest expense of $0.7 billion composed of interest
expense of $0.3 billion on UST Loans and interest expense of $0.2 billion on GMIO debt.
Old GM
In the period January 1, 2009 through July 9, 2009 results included: (1) centrally recorded Reorganization gains, net of $128.2
billion which is more fully discussed in Note 2 to the consolidated financial statements; (2) amortization of discounts related to the
UST Loan, EDC Loan and DIP Facilities of $3.7 billion; (3) a gain recorded on the UST Ally Financial Loan of $2.5 billion upon the
UST’s conversion of the UST Ally Financial Loan for Class B Common Membership Interests in Ally Financial, which gain resulted
from the difference between the fair value and the carrying amount of the Ally Financial equity interests given to the UST in exchange
for the UST Ally Financial Loan. The gain was partially offset by Old GM’s proportionate share of Ally Financial’s loss from
operations of $1.1 billion; (4) a loss related to the extinguishment of the UST Ally Financial Loan of $2.0 billion when the UST
exercised its option to convert outstanding amounts into shares of Ally Financial’s Class B Common Membership Interests; partially
offset by (5) a gain on extinguishment of debt of $0.9 billion related to an amendment to Old GM’s U.S. term loan; (6) interest
expense of $0.8 billion on unsecured debt balances; (7) interest expense of $0.4 billion on the UST Loan Facility; and (8) interest
expense of $0.2 billion on GMIO and GMSA debt.
In the year ended December 31, 2008 results included: (1) impairment charges of $7.1 billion related to Old GM’s investment in
Ally Financial’s Common Membership Interests; (2) charges of $4.8 billion related to the Delphi Benefit Guarantee Agreements;
(3) interest expense of $2.5 billion primarily composed of interest expense of $1.6 billion on Old GM’s unsecured bonds, interest
expense of $0.4 billion on Old GM’s Euro bonds and cross-currency swaps to hedge foreign exchange rate exposure and interest
expense of $0.1 billion on Old GM’s secured revolving credit facility and U.S. term loan; (4) income tax expense of $1.8 billion
related to valuation allowances against deferred tax assets in South Korea, the United Kingdom, Spain, and Australia; (5) impairment
charges of $1.0 billion related to Old GM’s investment in Ally Financial’s Preferred Membership Interests; (6) servicing fees, interest,
and depreciation expenses of $1.0 billion on the portfolio of automotive retail leases; partially offset by (7) global interest income of
$0.6 billion driven primarily by investments in GMSA and GME.
General Motors Company 2010 Annual Report 71