General Motors 2010 Annual Report Download - page 278
Download and view the complete annual report
Please find page 278 of the 2010 General Motors annual report below. You can navigate through the pages in the report by either clicking on the pages listed below, or by using the keyword search tool below to find specific information within the annual report.-
 1
1 -
2
-
3
-
4
-
5
-
6
-
7
-
8
-
9
-
10
-
11
-
12
-
13
-
14
-
15
-
16
-
17
-
18
-
19
-
20
-
21
-
22
-
23
-
24
-
25
-
26
-
27
-
28
-
29
-
30
-
31
-
32
-
33
-
34
-
35
-
36
-
37
-
38
-
39
-
40
-
41
-
42
-
43
-
44
-
45
-
46
-
47
-
48
-
49
-
50
-
51
-
52
-
53
-
54
-
55
-
56
-
57
-
58
-
59
-
60
-
61
-
62
-
63
-
64
-
65
-
66
-
67
-
68
-
69
-
70
-
71
-
72
-
73
-
74
-
75
-
76
-
77
-
78
-
79
-
80
-
81
-
82
-
83
-
84
-
85
-
86
-
87
-
88
-
89
-
90
-
91
-
92
-
93
-
94
-
95
-
96
-
97
-
98
-
99
-
100
-
101
-
102
-
103
-
104
-
105
-
106
-
107
-
108
-
109
-
110
-
111
-
112
-
113
-
114
-
115
-
116
-
117
-
118
-
119
-
120
-
121
-
122
-
123
-
124
-
125
-
126
-
127
-
128
-
129
-
130
-
131
-
132
-
133
-
134
-
135
-
136
-
137
-
138
-
139
-
140
-
141
-
142
-
143
-
144
-
145
-
146
-
147
-
148
-
149
-
150
-
151
-
152
-
153
-
154
-
155
-
156
-
157
-
158
-
159
-
160
-
161
-
162
-
163
-
164
-
165
-
166
-
167
-
168
-
169
-
170
-
171
-
172
-
173
-
174
-
175
-
176
-
177
-
178
-
179
-
180
-
181
-
182
-
183
-
184
-
185
-
186
-
187
-
188
-
189
-
190
-
191
-
192
-
193
-
194
-
195
-
196
-
197
-
198
-
199
-
200
-
201
-
202
-
203
-
204
-
205
-
206
-
207
-
208
-
209
-
210
-
211
-
212
-
213
-
214
-
215
-
216
-
217
-
218
-
219
-
220
-
221
-
222
-
223
-
224
-
225
-
226
-
227
-
228
-
229
-
230
-
231
-
232
-
233
-
234
-
235
-
236
-
237
-
238
-
239
-
240
-
241
-
242
-
243
-
244
-
245
-
246
-
247
-
248
-
249
-
250
-
251
-
252
-
253
-
254
-
255
-
256
-
257
-
258
-
259
-
260
-
261
-
262
-
263
-
264
-
265
-
266
-
267
-
 268
268 -
 269
269 -
 270
270 -
 271
271 -
 272
272 -
 273
273 -
 274
274 -
 275
275 -
 276
276 -
 277
277 -
 278
278 -
 279
279 -
 280
280 -
 281
281 -
 282
282 -
 283
283 -
 284
284 -
 285
285 -
 286
286 -
 287
287 -
 288
288 -
289
-
290
 |
 |
GENERAL MOTORS COMPANY AND SUBSIDIARIES
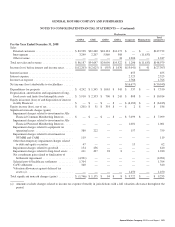
NOTES TO CONSOLIDATED FINANCIAL STATEMENTS — (Continued)
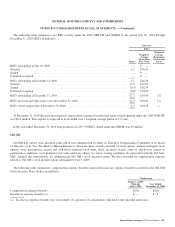
• Restructuring charges of $1.1 billion related to SUB and TSP.
• Reorganization costs of $1.1 billion, primarily related to loss on extinguishment of debt of $958 million.
• Impairment charges of $239 million related to product-specific tooling assets.
Results for the three months ended March 31, 2009 included:
• Old GM amended the terms of its U.S. term loan and recorded a gain of $906 million on the extinguishment of the original
loan facility.
• Upon Saab’s filing for reorganization, Old GM recorded charges of $618 million related to its net investment in, and advances
to, Saab and other commitments and obligations.
• Impairment charges of $327 million related to product-specific tooling assets and cancelled powertrain programs.
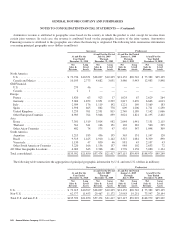
Note 35. Segment Reporting
Consolidated
We design, build and sell cars, trucks and parts worldwide. We also conduct our automotive finance operations through GM
Financial. We manage our operations through our five segments: GMNA, GME, GMIO, GMSA and GM Financial. Each segment has
a manager responsible for executing our strategies. Our automotive manufacturing operations are integrated within the segments,
benefit from broad-based trade agreements and are subject to regulatory requirements, such as Corporate Average Fuel Economy
(CAFE) regulations. While not all vehicles within a segment are individually profitable on a fully loaded cost basis, those vehicles are
needed in our product mix in order to attract customers to dealer showrooms and to maintain sales volumes for other, more profitable
vehicles. Because of these factors, we do not manage our business on an individual brand or vehicle basis. The chief operating
decision maker evaluates the operating results and performance of our automotive segments through Income (loss) before interest and
income taxes and evaluates GM Financial through Income (loss) before income taxes.
In the year ended December 31, 2010 we changed our managerial and financial reporting structure so that certain entities
geographically located within Russia and Uzbekistan were transferred from our GME segment to our GMIO segment, and certain
entities geographically located in Brazil, Argentina, Colombia, Ecuador, Venezuela, Bolivia, Chile, Paraguay, Peru and Uruguay were
transferred from our GMIO segment to our newly created GMSA segment. We have retrospectively revised the segment presentation
for all periods presented.
Substantially all of the cars, trucks and parts produced are marketed through retail dealers in North America, and through
distributors and dealers outside of North America, the substantial majority of which are independently owned.
In addition to the products sold to dealers for consumer retail sales, cars and trucks are also sold to fleet customers, including daily
rental car companies, commercial fleet customers, leasing companies and governments. Sales to fleet customers are completed
through the network of dealers and in some cases sold directly to fleet customers. Retail and fleet customers can obtain a wide range
of aftersale vehicle services and products through the dealer network, such as maintenance, light repairs, collision repairs, vehicle
accessories and extended service warranties.
GMNA primarily meets the demands of customers in North America with vehicles developed, manufactured and/or marketed under
the following four brands:
• Buick • Cadillac • Chevrolet • GMC
276 General Motors Company 2010 Annual Report