General Motors 2010 Annual Report Download - page 82
Download and view the complete annual report
Please find page 82 of the 2010 General Motors annual report below. You can navigate through the pages in the report by either clicking on the pages listed below, or by using the keyword search tool below to find specific information within the annual report.-
 1
1 -
2
-
3
-
4
-
5
-
6
-
7
-
8
-
9
-
10
-
11
-
12
-
13
-
14
-
15
-
16
-
17
-
18
-
19
-
20
-
21
-
22
-
23
-
24
-
25
-
26
-
27
-
28
-
29
-
30
-
31
-
32
-
33
-
34
-
35
-
36
-
37
-
38
-
39
-
40
-
41
-
42
-
43
-
44
-
45
-
46
-
47
-
48
-
49
-
50
-
51
-
52
-
53
-
54
-
55
-
56
-
57
-
58
-
59
-
60
-
61
-
62
-
63
-
64
-
65
-
66
-
67
-
68
-
69
-
70
-
71
-
 72
72 -
 73
73 -
 74
74 -
 75
75 -
 76
76 -
 77
77 -
 78
78 -
 79
79 -
 80
80 -
 81
81 -
 82
82 -
 83
83 -
 84
84 -
 85
85 -
 86
86 -
 87
87 -
 88
88 -
 89
89 -
 90
90 -
 91
91 -
 92
92 -
93
-
94
-
95
-
96
-
97
-
98
-
99
-
100
-
101
-
102
-
103
-
104
-
105
-
106
-
107
-
108
-
109
-
110
-
111
-
112
-
113
-
114
-
115
-
116
-
117
-
118
-
119
-
120
-
121
-
122
-
123
-
124
-
125
-
126
-
127
-
128
-
129
-
130
-
131
-
132
-
133
-
134
-
135
-
136
-
137
-
138
-
139
-
140
-
141
-
142
-
143
-
144
-
145
-
146
-
147
-
148
-
149
-
150
-
151
-
152
-
153
-
154
-
155
-
156
-
157
-
158
-
159
-
160
-
161
-
162
-
163
-
164
-
165
-
166
-
167
-
168
-
169
-
170
-
171
-
172
-
173
-
174
-
175
-
176
-
177
-
178
-
179
-
180
-
181
-
182
-
183
-
184
-
185
-
186
-
187
-
188
-
189
-
190
-
191
-
192
-
193
-
194
-
195
-
196
-
197
-
198
-
199
-
200
-
201
-
202
-
203
-
204
-
205
-
206
-
207
-
208
-
209
-
210
-
211
-
212
-
213
-
214
-
215
-
216
-
217
-
218
-
219
-
220
-
221
-
222
-
223
-
224
-
225
-
226
-
227
-
228
-
229
-
230
-
231
-
232
-
233
-
234
-
235
-
236
-
237
-
238
-
239
-
240
-
241
-
242
-
243
-
244
-
245
-
246
-
247
-
248
-
249
-
250
-
251
-
252
-
253
-
254
-
255
-
256
-
257
-
258
-
259
-
260
-
261
-
262
-
263
-
264
-
265
-
266
-
267
-
268
-
269
-
270
-
271
-
272
-
273
-
274
-
275
-
276
-
277
-
278
-
279
-
280
-
281
-
282
-
283
-
284
-
285
-
286
-
287
-
288
-
289
-
290
 |
 |
GENERAL MOTORS COMPANY AND SUBSIDIARIES
facilities and other committed credit facilities had $475 million available. At December 31, 2010 we had uncommitted credit facilities
of $490 million, under which we had borrowed $46 million leaving $444 million available. Uncommitted credit facilities include lines
of credit which are available to us, but under which the lenders have no legal obligation to provide funding upon our request. We and
our subsidiaries use credit facilities to fund working capital needs, product programs, facilities development and other general
corporate purposes.
In 2010 GM Daewoo repaid in full and retired its Korean Won 1.4 trillion (equivalent to $1.2 billion) revolving credit facility.
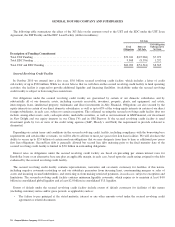
At December 31, 2009 we had committed credit facilities of $1.7 billion, under which we had borrowed $1.5 billion leaving $223
million available. Of these committed credit facilities GM Daewoo comprised $1.2 billion and other entities had $0.5 billion. At
December 31, 2009 we had uncommitted credit facilities of $842 million, under which we had borrowed $447 million leaving $395
million available.
At December 31, 2009 our largest credit facility was GM Daewoo’s Korean Won 1.4 trillion (equivalent to $1.2 billion) revolving
credit facility. The average interest rate on outstanding amounts under this facility at December 31, 2009 was 5.69%. At December 31,
2009 the facility was fully utilized with $1.2 billion outstanding.
Restricted Cash and Marketable Securities
Following the repayment of the UST Loans and the Canadian Loan in April 2010 as previously discussed, the remaining UST
escrow funds of $6.6 billion were released from escrow and became unrestricted as the availability of those funds was no longer
subject to the conditions set forth in the UST Credit Agreement.
Pursuant to an agreement among GMCL, EDC and an escrow agent we had $1.0 billion remaining in an escrow account at
December 31, 2010 to fund certain of GMCL’s healthcare obligations pending the satisfaction of certain preconditions which have not
yet been met.
In July 2009 we subscribed for additional common shares in GMCL and paid the subscription price in cash. As required under
certain agreements among GMCL, EDC, and an escrow agent, $3.6 billion of the subscription price was deposited into an escrow
account to fund certain of GMCL’s pension plans and HCT obligations pending completion of certain preconditions. In September
2009 GMCL contributed $3.0 billion to the Canadian hourly defined benefit pension plan and $651 million to the Canadian salaried
defined benefit pension plan, of which $2.7 billion was funded from the escrow account. In accordance with the terms of the escrow
agreement, $903 million was released from the escrow account to us in September 2009.
Cash Flow
Operating Activities
GM
In the year ended December 31, 2010 we had positive cash flows from operating activities of $6.6 billion primarily due to: (1) Net
income of $6.4 billion, which included non-cash charges of $7.1 billion resulting from depreciation, impairment and amortization of
long-lived assets and finite-lived intangible assets (including amortization of debt issuance costs and discounts); (2) dividends
received of $0.7 billion primarily related to our China JVs; partially offset by (3) pension contributions and OPEB payments of $5.7
billion primarily related to voluntary contributions to U.S. hourly and salary pension plans of $4.0 billion; (4) payments on our
previously announced restructuring programs of $1.3 billion partially offset by net charges of $0.6 billion; (5) dealer wind-down
payments of $0.4 billion; and (6) unfavorable changes in working capital of $0.6 billion. The unfavorable changes in working capital
were related to increases in accounts receivables, inventories and the completion of a change to weekly payment terms to our
suppliers, partially offset by an increase in accounts payable related to increased production volumes.
80 General Motors Company 2010 Annual Report