General Motors 2010 Annual Report Download - page 169
Download and view the complete annual report
Please find page 169 of the 2010 General Motors annual report below. You can navigate through the pages in the report by either clicking on the pages listed below, or by using the keyword search tool below to find specific information within the annual report.-
 1
1 -
2
-
3
-
4
-
5
-
6
-
7
-
8
-
9
-
10
-
11
-
12
-
13
-
14
-
15
-
16
-
17
-
18
-
19
-
20
-
21
-
22
-
23
-
24
-
25
-
26
-
27
-
28
-
29
-
30
-
31
-
32
-
33
-
34
-
35
-
36
-
37
-
38
-
39
-
40
-
41
-
42
-
43
-
44
-
45
-
46
-
47
-
48
-
49
-
50
-
51
-
52
-
53
-
54
-
55
-
56
-
57
-
58
-
59
-
60
-
61
-
62
-
63
-
64
-
65
-
66
-
67
-
68
-
69
-
70
-
71
-
72
-
73
-
74
-
75
-
76
-
77
-
78
-
79
-
80
-
81
-
82
-
83
-
84
-
85
-
86
-
87
-
88
-
89
-
90
-
91
-
92
-
93
-
94
-
95
-
96
-
97
-
98
-
99
-
100
-
101
-
102
-
103
-
104
-
105
-
106
-
107
-
108
-
109
-
110
-
111
-
112
-
113
-
114
-
115
-
116
-
117
-
118
-
119
-
120
-
121
-
122
-
123
-
124
-
125
-
126
-
127
-
128
-
129
-
130
-
131
-
132
-
133
-
134
-
135
-
136
-
137
-
138
-
139
-
140
-
141
-
142
-
143
-
144
-
145
-
146
-
147
-
148
-
149
-
150
-
151
-
152
-
153
-
154
-
155
-
156
-
157
-
158
-
 159
159 -
 160
160 -
 161
161 -
 162
162 -
 163
163 -
 164
164 -
 165
165 -
 166
166 -
 167
167 -
 168
168 -
 169
169 -
 170
170 -
 171
171 -
 172
172 -
 173
173 -
 174
174 -
 175
175 -
 176
176 -
 177
177 -
 178
178 -
 179
179 -
180
-
181
-
182
-
183
-
184
-
185
-
186
-
187
-
188
-
189
-
190
-
191
-
192
-
193
-
194
-
195
-
196
-
197
-
198
-
199
-
200
-
201
-
202
-
203
-
204
-
205
-
206
-
207
-
208
-
209
-
210
-
211
-
212
-
213
-
214
-
215
-
216
-
217
-
218
-
219
-
220
-
221
-
222
-
223
-
224
-
225
-
226
-
227
-
228
-
229
-
230
-
231
-
232
-
233
-
234
-
235
-
236
-
237
-
238
-
239
-
240
-
241
-
242
-
243
-
244
-
245
-
246
-
247
-
248
-
249
-
250
-
251
-
252
-
253
-
254
-
255
-
256
-
257
-
258
-
259
-
260
-
261
-
262
-
263
-
264
-
265
-
266
-
267
-
268
-
269
-
270
-
271
-
272
-
273
-
274
-
275
-
276
-
277
-
278
-
279
-
280
-
281
-
282
-
283
-
284
-
285
-
286
-
287
-
288
-
289
-
290
 |
 |

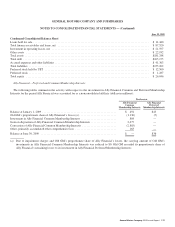
GENERAL MOTORS COMPANY AND SUBSIDIARIES
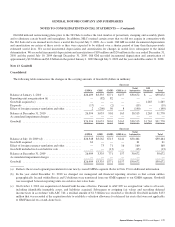
NOTES TO CONSOLIDATED FINANCIAL STATEMENTS — (Continued)
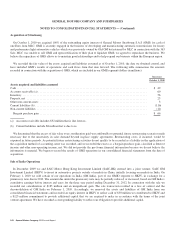
Credit Quality
Credit bureau scores, generally referred to as FICO scores, are determined during GM Financial’s automotive loan origination
process. The following table summarizes the credit risk profile of finance receivables by FICO score band, determined at origination
(dollars in millions):
Successor
December 31, 2010
FICO score less than 540 ........................................................................ $1,328
FICO score 540 to 599 .......................................................................... 3,396
FICO score 600 to 659 .......................................................................... 2,758
FICO score greater than 660 ...................................................................... 1,166
Total finance receivables ........................................................................ $8,648
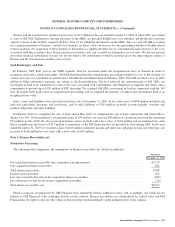
Delinquency
The following summarizes finance receivables more than 30 days delinquent, but not yet in repossession, and in repossession, but
not yet charged off (dollars in millions):
Successor
December 31, 2010
Amount Percent
Delinquent contracts
31 to 60 days .................................................................................. $535 6.2%
Greater-than-60 days ............................................................................ 212 2.4%
Total finance receivables more than 30 days delinquent ................................................ 747 8.6%
In repossession ................................................................................ 28 0.3%
Total finance receivables more than 30 days delinquent and in repossession ................................ $775 8.9%
An account is considered delinquent if a substantial portion of a scheduled payment has not been received by the date such payment
was contractually due. Delinquencies may vary from period to period based upon the average age of the portfolio, seasonality within
the calendar year and economic factors.
Note 7. Securitizations
Automotive Financing
The following table summarizes securitization activity and cash flows from SPEs used for securitizations (dollars in millions):
Successor
October 1, 2010
Through
December 31, 2010
Receivables securitized .......................................................................... $743
Net proceeds from securitization .................................................................. $700
Servicing fees
Variable interest entities ......................................................................... $ 46
Distributions from Trusts
Variable interest entities ......................................................................... $216
GM Financial retains servicing responsibilities for receivables transferred to certain SPEs. At December 31, 2010 GM Financial
serviced finance receivables that have been transferred to certain SPEs of $7.2 billion.
General Motors Company 2010 Annual Report 167