General Motors 2010 Annual Report Download - page 138
Download and view the complete annual report
Please find page 138 of the 2010 General Motors annual report below. You can navigate through the pages in the report by either clicking on the pages listed below, or by using the keyword search tool below to find specific information within the annual report.-
 1
1 -
2
-
3
-
4
-
5
-
6
-
7
-
8
-
9
-
10
-
11
-
12
-
13
-
14
-
15
-
16
-
17
-
18
-
19
-
20
-
21
-
22
-
23
-
24
-
25
-
26
-
27
-
28
-
29
-
30
-
31
-
32
-
33
-
34
-
35
-
36
-
37
-
38
-
39
-
40
-
41
-
42
-
43
-
44
-
45
-
46
-
47
-
48
-
49
-
50
-
51
-
52
-
53
-
54
-
55
-
56
-
57
-
58
-
59
-
60
-
61
-
62
-
63
-
64
-
65
-
66
-
67
-
68
-
69
-
70
-
71
-
72
-
73
-
74
-
75
-
76
-
77
-
78
-
79
-
80
-
81
-
82
-
83
-
84
-
85
-
86
-
87
-
88
-
89
-
90
-
91
-
92
-
93
-
94
-
95
-
96
-
97
-
98
-
99
-
100
-
101
-
102
-
103
-
104
-
105
-
106
-
107
-
108
-
109
-
110
-
111
-
112
-
113
-
114
-
115
-
116
-
117
-
118
-
119
-
120
-
121
-
122
-
123
-
124
-
125
-
126
-
127
-
 128
128 -
 129
129 -
 130
130 -
 131
131 -
 132
132 -
 133
133 -
 134
134 -
 135
135 -
 136
136 -
 137
137 -
 138
138 -
 139
139 -
 140
140 -
 141
141 -
 142
142 -
 143
143 -
 144
144 -
 145
145 -
 146
146 -
 147
147 -
 148
148 -
149
-
150
-
151
-
152
-
153
-
154
-
155
-
156
-
157
-
158
-
159
-
160
-
161
-
162
-
163
-
164
-
165
-
166
-
167
-
168
-
169
-
170
-
171
-
172
-
173
-
174
-
175
-
176
-
177
-
178
-
179
-
180
-
181
-
182
-
183
-
184
-
185
-
186
-
187
-
188
-
189
-
190
-
191
-
192
-
193
-
194
-
195
-
196
-
197
-
198
-
199
-
200
-
201
-
202
-
203
-
204
-
205
-
206
-
207
-
208
-
209
-
210
-
211
-
212
-
213
-
214
-
215
-
216
-
217
-
218
-
219
-
220
-
221
-
222
-
223
-
224
-
225
-
226
-
227
-
228
-
229
-
230
-
231
-
232
-
233
-
234
-
235
-
236
-
237
-
238
-
239
-
240
-
241
-
242
-
243
-
244
-
245
-
246
-
247
-
248
-
249
-
250
-
251
-
252
-
253
-
254
-
255
-
256
-
257
-
258
-
259
-
260
-
261
-
262
-
263
-
264
-
265
-
266
-
267
-
268
-
269
-
270
-
271
-
272
-
273
-
274
-
275
-
276
-
277
-
278
-
279
-
280
-
281
-
282
-
283
-
284
-
285
-
286
-
287
-
288
-
289
-
290
 |
 |

GENERAL MOTORS COMPANY AND SUBSIDIARIES
NOTES TO CONSOLIDATED FINANCIAL STATEMENTS — (Continued)
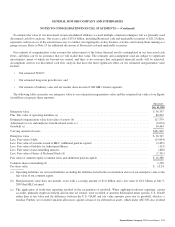
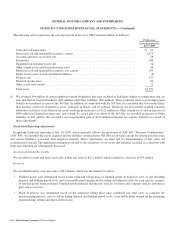
The following table summarizes the carrying amount of the assets MLC retained (dollars in millions):
Predecessor
Carrying amount at
July 9, 2009
Cash and cash equivalents .............................................................. $ 41
Restricted cash and marketable securities, current ........................................... 1,175
Accounts and notes receivable, net ....................................................... 28
Inventories .......................................................................... 140
Equipment on operating leases, net ....................................................... (2)
Other current assets and deferred income taxes ............................................. 46
Restricted cash and marketable securities, non-current ....................................... 144
Equity in net assets of nonconsolidated affiliates ............................................ (4)
Property, net ........................................................................ 137
Deferred income taxes ................................................................. 80
Other assets, non-current ............................................................... 12
Total assets ......................................................................... $1,797
(f) We assumed $94 million of certain employee benefit obligations that were included in Liabilities subject to compromise that are
now included in Accrued liabilities ($64 million) and Other liabilities ($30 million). These primarily relate to postemployment
benefits not modified as a part of the 363 Sale. In addition, in connection with the 363 Sale, we concluded that it was more likely
than not that certain net deferred tax assets, primarily in Brazil, will be realized. Therefore, we reversed the existing valuation
allowances related to such deferred tax assets resulting in an increase of $121 million in Other current assets and an increase of
$630 million in Deferred income taxes, non-current. To record other tax effects of the 363 Sale, we recorded an increase to Other
liabilities of $41 million. We recorded a net reorganization gain of $710 million in Income tax expense (benefit) as a result of
these adjustments.
Fresh-Start Reporting Adjustments
In applying fresh-start reporting at July 10, 2009, which generally follows the provisions of ASC 805, “Business Combinations”
(ASC 805), we recorded the assets acquired and the liabilities assumed from Old GM at fair value except for deferred income taxes
and certain liabilities associated with employee benefits. These adjustments are final and no determinations of fair value are
considered provisional. The significant assumptions related to the valuations of our assets and liabilities recorded in connection with
fresh-start reporting are subsequently discussed.
Accounts and Notes Receivable
We recorded Accounts and notes receivable at their fair value of $12.2 billion, which resulted in a decrease of $79 million.
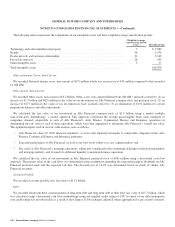
Inventory
We recorded Inventory at its fair value of $9.6 billion, which was determined as follows:
• Finished goods were determined based on the estimated selling price of finished goods on hand less costs to sell including
disposal and holding period costs, and a reasonable profit margin on the selling and disposal effort for each specific category
of finished goods being evaluated. Finished goods primarily include new vehicles, off-lease and company vehicles and service
parts and accessories;
• Work in process was determined based on the estimated selling price once completed less total costs to complete the
manufacturing process, costs to sell including disposal and holding period costs, a reasonable profit margin on the remaining
manufacturing, selling and disposal effort; and
136 General Motors Company 2010 Annual Report