General Motors 2010 Annual Report Download - page 59
Download and view the complete annual report
Please find page 59 of the 2010 General Motors annual report below. You can navigate through the pages in the report by either clicking on the pages listed below, or by using the keyword search tool below to find specific information within the annual report.-
 1
1 -
2
-
3
-
4
-
5
-
6
-
7
-
8
-
9
-
10
-
11
-
12
-
13
-
14
-
15
-
16
-
17
-
18
-
19
-
20
-
21
-
22
-
23
-
24
-
25
-
26
-
27
-
28
-
29
-
30
-
31
-
32
-
33
-
34
-
35
-
36
-
37
-
38
-
39
-
40
-
41
-
42
-
43
-
44
-
45
-
46
-
47
-
48
-
 49
49 -
 50
50 -
 51
51 -
 52
52 -
 53
53 -
 54
54 -
 55
55 -
 56
56 -
 57
57 -
 58
58 -
 59
59 -
 60
60 -
 61
61 -
 62
62 -
 63
63 -
 64
64 -
 65
65 -
 66
66 -
 67
67 -
 68
68 -
 69
69 -
70
-
71
-
72
-
73
-
74
-
75
-
76
-
77
-
78
-
79
-
80
-
81
-
82
-
83
-
84
-
85
-
86
-
87
-
88
-
89
-
90
-
91
-
92
-
93
-
94
-
95
-
96
-
97
-
98
-
99
-
100
-
101
-
102
-
103
-
104
-
105
-
106
-
107
-
108
-
109
-
110
-
111
-
112
-
113
-
114
-
115
-
116
-
117
-
118
-
119
-
120
-
121
-
122
-
123
-
124
-
125
-
126
-
127
-
128
-
129
-
130
-
131
-
132
-
133
-
134
-
135
-
136
-
137
-
138
-
139
-
140
-
141
-
142
-
143
-
144
-
145
-
146
-
147
-
148
-
149
-
150
-
151
-
152
-
153
-
154
-
155
-
156
-
157
-
158
-
159
-
160
-
161
-
162
-
163
-
164
-
165
-
166
-
167
-
168
-
169
-
170
-
171
-
172
-
173
-
174
-
175
-
176
-
177
-
178
-
179
-
180
-
181
-
182
-
183
-
184
-
185
-
186
-
187
-
188
-
189
-
190
-
191
-
192
-
193
-
194
-
195
-
196
-
197
-
198
-
199
-
200
-
201
-
202
-
203
-
204
-
205
-
206
-
207
-
208
-
209
-
210
-
211
-
212
-
213
-
214
-
215
-
216
-
217
-
218
-
219
-
220
-
221
-
222
-
223
-
224
-
225
-
226
-
227
-
228
-
229
-
230
-
231
-
232
-
233
-
234
-
235
-
236
-
237
-
238
-
239
-
240
-
241
-
242
-
243
-
244
-
245
-
246
-
247
-
248
-
249
-
250
-
251
-
252
-
253
-
254
-
255
-
256
-
257
-
258
-
259
-
260
-
261
-
262
-
263
-
264
-
265
-
266
-
267
-
268
-
269
-
270
-
271
-
272
-
273
-
274
-
275
-
276
-
277
-
278
-
279
-
280
-
281
-
282
-
283
-
284
-
285
-
286
-
287
-
288
-
289
-
290
 |
 |
GENERAL MOTORS COMPANY AND SUBSIDIARIES
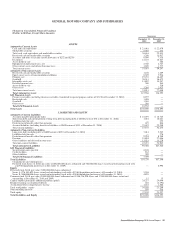
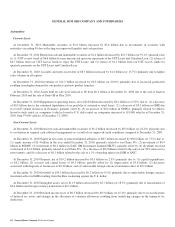
At December 31, 2010 Assets held for sale were reduced to $0 from $0.5 billion at December 31, 2009 due to the sale of certain of
our India operations (GM India) in February 2010. We classified these Assets held for sale as long-term at December 31, 2009
because we received a promissory note in exchange for GM India that does not convert to cash within one year.
At December 31, 2010 Other assets of $3.3 billion increased by $0.7 billion (or 25.3%) primarily due to: (1) increase of $0.3 billion
in long-term notes receivable resulting primarily from the sale of GM India of $0.2 billion; (2) increase of $0.1 billion due to
capitalization of debt issuance costs associated with the secured revolving credit facility; and (3) increase of $0.1 billion due to
amounts paid into insurance funds for employees in early retirement programs.
Current Liabilities
At December 31, 2010 Accounts payable of $21.5 billion increased by $2.8 billion (or 14.8%) primarily due to higher payables for
materials due to increased production volumes.
At December 31, 2010 Short-term debt and current portion of long-term debt of $1.6 billion decreased by $8.6 billion (or 84.2%)
primarily due to: (1) repayment of the UST Loans and Canadian Loan of $7.0 billion; (2) repayment of the GM Daewoo credit facility
of $1.2 billion; and (3) a net change in other obligations of $0.4 billion.
At December 31, 2010 Liabilities held for sale were reduced to $0 from $0.4 billion at December 31, 2009 due to the sale of Saab
in February 2010 and the sale of Saab GB in May 2010 to Spyker Cars NV.
At December 31, 2010 Accrued liabilities of $23.4 billion increased by $1.1 billion (or 5.1%) primarily due to: (1) increase in
GMNA due to higher customer deposits related to the increased number of vehicles leased to daily rental car companies of $0.5
billion; (2) increase due to tax related accruals reclassified from non-current to current of $0.3 billion; and (3) other miscellaneous
accruals of $0.3 billion.
Non-Current Liabilities
At December 31, 2010 Long-term debt of $3.0 billion decreased by $2.5 billion (or 45.8%), primarily due to the repayment in full
of the VEBA Notes composed of the outstanding amount (together with accreted interest thereon) of $2.8 billion and resulting gain of
$0.2 billion, partially offset by additional net borrowings of $0.4 billion and unfavorable foreign currency translation effect of $0.1
billion.
At December 31, 2010 Liabilities held for sale were reduced to $0 from $0.3 billion at December 31, 2009 due to the sale of GM
India in February 2010. We classified these Liabilities held for sale as long-term at December 31, 2009 because we received a
promissory note in exchange for GM India that does not convert to cash within one year.
At December 31, 2010 our Postretirement benefits other than pensions liability of $9.3 billion increased by $0.6 billion (or 6.7%)
primarily due to year-end remeasurement effects of $0.4 billion driven by discount rate reductions in the valuation assumptions and
unfavorable foreign currency translation effect of $0.2 billion due to the strengthening of the Canadian dollar against the U.S dollar.
At December 31, 2010 our Pensions liability of $21.9 billion decreased by $5.2 billion (or 19.2%) primarily due to net contributions
and benefit payments of $4.9 billion and favorable foreign currency translation effect of $0.3 billion. Gains from asset returns greater
than expected were primarily offset by actuarial losses from discount rate decreases.
At December 31, 2010 Other liabilities and deferred income taxes of $13.0 billion decreased by $0.3 billion (or 1.9%) primarily due
to: (1) decrease in plant closing liability in GMNA due to payments made in 2010 and employee related adjustments of $0.4 billion;
(2) decrease due to tax related accruals classified to current of $0.3 billion; partially offset by (3) increase in deferred taxes of $0.4
billion.
General Motors Company 2010 Annual Report 57