General Motors 2010 Annual Report Download - page 172
Download and view the complete annual report
Please find page 172 of the 2010 General Motors annual report below. You can navigate through the pages in the report by either clicking on the pages listed below, or by using the keyword search tool below to find specific information within the annual report.-
 1
1 -
2
-
3
-
4
-
5
-
6
-
7
-
8
-
9
-
10
-
11
-
12
-
13
-
14
-
15
-
16
-
17
-
18
-
19
-
20
-
21
-
22
-
23
-
24
-
25
-
26
-
27
-
28
-
29
-
30
-
31
-
32
-
33
-
34
-
35
-
36
-
37
-
38
-
39
-
40
-
41
-
42
-
43
-
44
-
45
-
46
-
47
-
48
-
49
-
50
-
51
-
52
-
53
-
54
-
55
-
56
-
57
-
58
-
59
-
60
-
61
-
62
-
63
-
64
-
65
-
66
-
67
-
68
-
69
-
70
-
71
-
72
-
73
-
74
-
75
-
76
-
77
-
78
-
79
-
80
-
81
-
82
-
83
-
84
-
85
-
86
-
87
-
88
-
89
-
90
-
91
-
92
-
93
-
94
-
95
-
96
-
97
-
98
-
99
-
100
-
101
-
102
-
103
-
104
-
105
-
106
-
107
-
108
-
109
-
110
-
111
-
112
-
113
-
114
-
115
-
116
-
117
-
118
-
119
-
120
-
121
-
122
-
123
-
124
-
125
-
126
-
127
-
128
-
129
-
130
-
131
-
132
-
133
-
134
-
135
-
136
-
137
-
138
-
139
-
140
-
141
-
142
-
143
-
144
-
145
-
146
-
147
-
148
-
149
-
150
-
151
-
152
-
153
-
154
-
155
-
156
-
157
-
158
-
159
-
160
-
161
-
 162
162 -
 163
163 -
 164
164 -
 165
165 -
 166
166 -
 167
167 -
 168
168 -
 169
169 -
 170
170 -
 171
171 -
 172
172 -
 173
173 -
 174
174 -
 175
175 -
 176
176 -
 177
177 -
 178
178 -
 179
179 -
 180
180 -
 181
181 -
 182
182 -
183
-
184
-
185
-
186
-
187
-
188
-
189
-
190
-
191
-
192
-
193
-
194
-
195
-
196
-
197
-
198
-
199
-
200
-
201
-
202
-
203
-
204
-
205
-
206
-
207
-
208
-
209
-
210
-
211
-
212
-
213
-
214
-
215
-
216
-
217
-
218
-
219
-
220
-
221
-
222
-
223
-
224
-
225
-
226
-
227
-
228
-
229
-
230
-
231
-
232
-
233
-
234
-
235
-
236
-
237
-
238
-
239
-
240
-
241
-
242
-
243
-
244
-
245
-
246
-
247
-
248
-
249
-
250
-
251
-
252
-
253
-
254
-
255
-
256
-
257
-
258
-
259
-
260
-
261
-
262
-
263
-
264
-
265
-
266
-
267
-
268
-
269
-
270
-
271
-
272
-
273
-
274
-
275
-
276
-
277
-
278
-
279
-
280
-
281
-
282
-
283
-
284
-
285
-
286
-
287
-
288
-
289
-
290
 |
 |
GENERAL MOTORS COMPANY AND SUBSIDIARIES
NOTES TO CONSOLIDATED FINANCIAL STATEMENTS — (Continued)
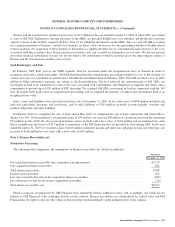
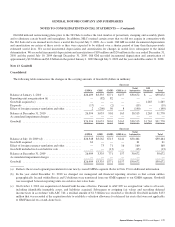
The following table summarizes depreciation expense and impairment charges related to Equipment on operating leases, net
(dollars in millions):
Successor Predecessor
Year Ended
December 31, 2010
July 10, 2009
Through
December 31, 2009
January 1, 2009
Through
July 9, 2009
Year Ended
December 31, 2008
Depreciation expense and impairment charges ............. $549 $586 $338 $1,575
Refer to Note 26 for additional information on impairment charges related to Equipment on operating leases, net.
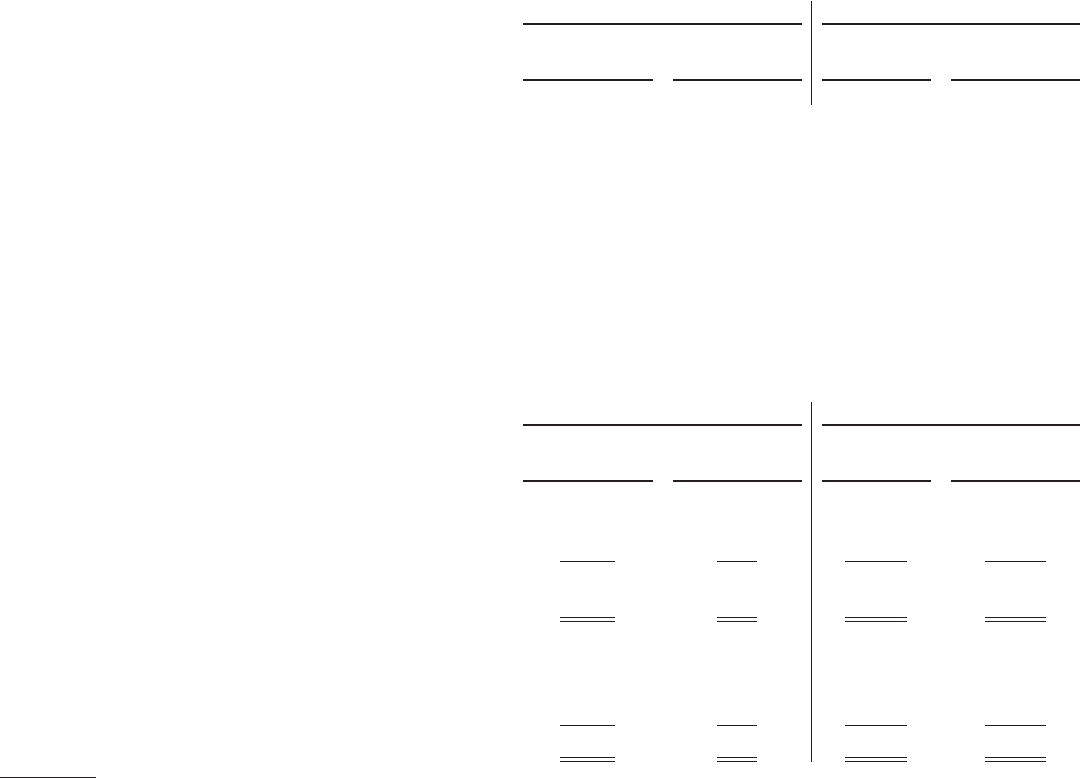
Note 11. Equity in Net Assets of Nonconsolidated Affiliates
Automotive
Nonconsolidated affiliates are entities in which an equity ownership interest is maintained and for which the equity method of
accounting is used, due to the ability to exert significant influence over decisions relating to their operating and financial affairs.
The following table summarizes information regarding equity in income (loss) of and disposition of interest in nonconsolidated
affiliates (dollars in millions):
Successor Predecessor
Year Ended
December 31, 2010
July 10, 2009
Through
December 31, 2009
January 1, 2009
Through
July 9, 2009
Year Ended
December 31, 2008
Ally Financial ...................................... $ — $ — $(1,097) $ 916
Gain on conversion of UST Ally Financial Loan ........... — — 2,477 —
Ally Common Membership Interest impairment charges ..... — — — (7,099)
Total equity in income (loss) of and disposition of interest in
Ally Financial .................................... $ — $ — $1,380 $(6,183)
China JVs (a) ....................................... $1,297 $460 $ 300 $ 315
New United Motor Manufacturing, Inc. (b) ............... — — (243) (118)
New Delphi (c) ..................................... 117 (1) — —
Others ............................................ 24 38 4 (11)
Total equity income, net of tax ......................... $1,438 $497 $ 61 $ 186
(a) Includes Shanghai General Motors Co., Ltd. (SGM) (49%) in the period February 1, 2010 through December 31, 2010 and
(50%) in the month of January 2010, in the periods July 10, 2009 through December 31, 2009 and January 1, 2009 through
July 9, 2009, and in the year ended December 31, 2008 and SAIC-GM-Wuling Automobile Co., Ltd. (SGMW) (44%) in the
period November 16, 2010 through December 31, 2010 and (34%) in the periods January 1, 2010 through November 15,
2010, July 10, 2009 through December 31, 2009, January 1, 2009 through July 9, 2009, and the year ended December 31, 2008.
(b) New United Motor Manufacturing, Inc. (NUMMI) (50%) was retained by MLC as a part of the 363 Sale.
(c) New Delphi was acquired in October 2009. Refer to Note 5 for additional information on acquisition of Delphi businesses.
Investment in China JVs
Our Chinese operations, which we established beginning in 1997, are comprised of the following joint ventures: SGM, SGMW,
FAW-GM Light Duty Commercial Vehicle, Ltd. (FAW-GM), Pan Asia Technical Automotive Center Co., Ltd. (PATAC), Shanghai
OnStar Telematics Co. Ltd. (Shanghai OnStar) and Shanghai Chengxin Used Car Operation and Management Co., Ltd. (Used Car
170 General Motors Company 2010 Annual Report