General Motors 2010 Annual Report Download - page 220
Download and view the complete annual report
Please find page 220 of the 2010 General Motors annual report below. You can navigate through the pages in the report by either clicking on the pages listed below, or by using the keyword search tool below to find specific information within the annual report.-
 1
1 -
2
-
3
-
4
-
5
-
6
-
7
-
8
-
9
-
10
-
11
-
12
-
13
-
14
-
15
-
16
-
17
-
18
-
19
-
20
-
21
-
22
-
23
-
24
-
25
-
26
-
27
-
28
-
29
-
30
-
31
-
32
-
33
-
34
-
35
-
36
-
37
-
38
-
39
-
40
-
41
-
42
-
43
-
44
-
45
-
46
-
47
-
48
-
49
-
50
-
51
-
52
-
53
-
54
-
55
-
56
-
57
-
58
-
59
-
60
-
61
-
62
-
63
-
64
-
65
-
66
-
67
-
68
-
69
-
70
-
71
-
72
-
73
-
74
-
75
-
76
-
77
-
78
-
79
-
80
-
81
-
82
-
83
-
84
-
85
-
86
-
87
-
88
-
89
-
90
-
91
-
92
-
93
-
94
-
95
-
96
-
97
-
98
-
99
-
100
-
101
-
102
-
103
-
104
-
105
-
106
-
107
-
108
-
109
-
110
-
111
-
112
-
113
-
114
-
115
-
116
-
117
-
118
-
119
-
120
-
121
-
122
-
123
-
124
-
125
-
126
-
127
-
128
-
129
-
130
-
131
-
132
-
133
-
134
-
135
-
136
-
137
-
138
-
139
-
140
-
141
-
142
-
143
-
144
-
145
-
146
-
147
-
148
-
149
-
150
-
151
-
152
-
153
-
154
-
155
-
156
-
157
-
158
-
159
-
160
-
161
-
162
-
163
-
164
-
165
-
166
-
167
-
168
-
169
-
170
-
171
-
172
-
173
-
174
-
175
-
176
-
177
-
178
-
179
-
180
-
181
-
182
-
183
-
184
-
185
-
186
-
187
-
188
-
189
-
190
-
191
-
192
-
193
-
194
-
195
-
196
-
197
-
198
-
199
-
200
-
201
-
202
-
203
-
204
-
205
-
206
-
207
-
208
-
209
-
 210
210 -
 211
211 -
 212
212 -
 213
213 -
 214
214 -
 215
215 -
 216
216 -
 217
217 -
 218
218 -
 219
219 -
 220
220 -
 221
221 -
 222
222 -
 223
223 -
 224
224 -
 225
225 -
 226
226 -
 227
227 -
 228
228 -
 229
229 -
 230
230 -
231
-
232
-
233
-
234
-
235
-
236
-
237
-
238
-
239
-
240
-
241
-
242
-
243
-
244
-
245
-
246
-
247
-
248
-
249
-
250
-
251
-
252
-
253
-
254
-
255
-
256
-
257
-
258
-
259
-
260
-
261
-
262
-
263
-
264
-
265
-
266
-
267
-
268
-
269
-
270
-
271
-
272
-
273
-
274
-
275
-
276
-
277
-
278
-
279
-
280
-
281
-
282
-
283
-
284
-
285
-
286
-
287
-
288
-
289
-
290
 |
 |

GENERAL MOTORS COMPANY AND SUBSIDIARIES
NOTES TO CONSOLIDATED FINANCIAL STATEMENTS — (Continued)
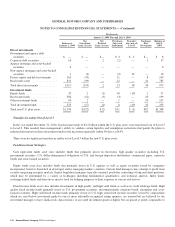
Investment Trusts Transfers In and/or Out of Level 3
During the year ended December 31, 2010 significant transfers out of Level 3 to Level 2 included government and agency debt
securities of $1.3 billion, corporate debt securities of $0.7 billion and non-agency mortgage and asset-backed securities of $0.7 billion.
These transfers were primarily the result of improved pricing transparency of these securities, which allowed management to
corroborate observable pricing inputs received from independent pricing services.
During the year ended December 31, 2010 investment funds of $0.6 billion were transferred out of Level 3 to Level 2. This resulted
from management’s ability to validate certain liquidity and redemption restrictions that permit the Investment Trusts to redeem their
interest in these investment funds in the near-term (generally within 90 days) at NAV.
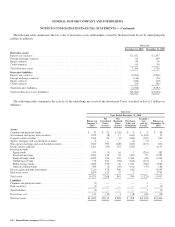
OPEB Plan Assets and Fair Value Measurements
As a result of the December 31, 2009 UAW hourly retiree medical plan settlement, there were no significant OPEB plan assets at
December 31, 2010.
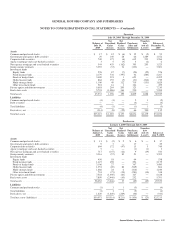
The following table summarizes the fair value of OPEB plan assets by asset category (dollars in millions):
Successor
Fair Value Measurements
at December 31, 2009
Level 1 Level 2 Level 3
Total U.S.
Plan Assets
Direct investments
Cash equivalents and other short-term investments .................................... $— $28 $— $28
Investment Funds — Mutual and commingled funds ................................... — 37 — 37
Other ........................................................................ — — 2 2
Total assets .................................................................... $— $65 $ 2 67
Employee-owned assets .......................................................... (10)
Net non-security liabilities ........................................................ (26)
Total OPEB plan assets .......................................................... $31
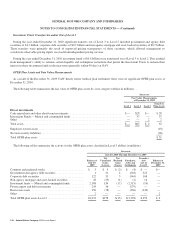
The following tables summarize the activity for the OPEB plan assets classified in Level 3 (dollars in millions):
Successor
July 10, 2009 Through December 31, 2009
Balance at
July 10,
2009
Net
Unrealized
Gains
(Losses)
Net
Realized
Gains
(Losses)
Purchases,
Sales and
Settlements
Transfers
into
(out of)
Level 3
Balance at
December 31,
2009
Common and preferred stocks ........................... $ 3 $ 3 $ (2) $ (4) $ — $—
Government and agency debt securities .................... 1 21 4 (248) 222 —
Corporate debt securities ............................... 122 51 3 (344) 168 —
Non-agency mortgage and asset-backed securities ........... 18 (29) (1) (2) 14 —
Investment funds — Mutual and commingled funds .......... 2,188 154 (17) (2,315) (10) —
Private equity and debt investments ....................... 243 36 — (279) — —
Real estate assets ..................................... 356 (78) — (136) (142) —
Other ............................................... 2 — — — — 2
Total OPEB plan assets Level 3 .......................... $2,933 $158 $(13) $(3,328) $ 252 $ 2
218 General Motors Company 2010 Annual Report