General Motors 2010 Annual Report Download - page 173
Download and view the complete annual report
Please find page 173 of the 2010 General Motors annual report below. You can navigate through the pages in the report by either clicking on the pages listed below, or by using the keyword search tool below to find specific information within the annual report.-
 1
1 -
2
-
3
-
4
-
5
-
6
-
7
-
8
-
9
-
10
-
11
-
12
-
13
-
14
-
15
-
16
-
17
-
18
-
19
-
20
-
21
-
22
-
23
-
24
-
25
-
26
-
27
-
28
-
29
-
30
-
31
-
32
-
33
-
34
-
35
-
36
-
37
-
38
-
39
-
40
-
41
-
42
-
43
-
44
-
45
-
46
-
47
-
48
-
49
-
50
-
51
-
52
-
53
-
54
-
55
-
56
-
57
-
58
-
59
-
60
-
61
-
62
-
63
-
64
-
65
-
66
-
67
-
68
-
69
-
70
-
71
-
72
-
73
-
74
-
75
-
76
-
77
-
78
-
79
-
80
-
81
-
82
-
83
-
84
-
85
-
86
-
87
-
88
-
89
-
90
-
91
-
92
-
93
-
94
-
95
-
96
-
97
-
98
-
99
-
100
-
101
-
102
-
103
-
104
-
105
-
106
-
107
-
108
-
109
-
110
-
111
-
112
-
113
-
114
-
115
-
116
-
117
-
118
-
119
-
120
-
121
-
122
-
123
-
124
-
125
-
126
-
127
-
128
-
129
-
130
-
131
-
132
-
133
-
134
-
135
-
136
-
137
-
138
-
139
-
140
-
141
-
142
-
143
-
144
-
145
-
146
-
147
-
148
-
149
-
150
-
151
-
152
-
153
-
154
-
155
-
156
-
157
-
158
-
159
-
160
-
161
-
162
-
 163
163 -
 164
164 -
 165
165 -
 166
166 -
 167
167 -
 168
168 -
 169
169 -
 170
170 -
 171
171 -
 172
172 -
 173
173 -
 174
174 -
 175
175 -
 176
176 -
 177
177 -
 178
178 -
 179
179 -
 180
180 -
 181
181 -
 182
182 -
 183
183 -
184
-
185
-
186
-
187
-
188
-
189
-
190
-
191
-
192
-
193
-
194
-
195
-
196
-
197
-
198
-
199
-
200
-
201
-
202
-
203
-
204
-
205
-
206
-
207
-
208
-
209
-
210
-
211
-
212
-
213
-
214
-
215
-
216
-
217
-
218
-
219
-
220
-
221
-
222
-
223
-
224
-
225
-
226
-
227
-
228
-
229
-
230
-
231
-
232
-
233
-
234
-
235
-
236
-
237
-
238
-
239
-
240
-
241
-
242
-
243
-
244
-
245
-
246
-
247
-
248
-
249
-
250
-
251
-
252
-
253
-
254
-
255
-
256
-
257
-
258
-
259
-
260
-
261
-
262
-
263
-
264
-
265
-
266
-
267
-
268
-
269
-
270
-
271
-
272
-
273
-
274
-
275
-
276
-
277
-
278
-
279
-
280
-
281
-
282
-
283
-
284
-
285
-
286
-
287
-
288
-
289
-
290
 |
 |

GENERAL MOTORS COMPANY AND SUBSIDIARIES
NOTES TO CONSOLIDATED FINANCIAL STATEMENTS — (Continued)
JV), collectively referred to as the China JVs. Sales and income of these joint ventures are not consolidated into our financial
statements; rather, our proportionate share of the earnings of each joint venture is reflected as Equity income, net of tax.
SGM is a joint venture established by Shanghai Automotive Industry Corporation (SAIC) (51%) and us (49%) in 1997. SGM has
interests in three other joint ventures in China — Shanghai GM (Shenyang) Norsom Motor Co., Ltd (SGM Norsom), Shanghai GM
Dong Yue Motors Co., Ltd (SGM DY) and Shanghai GM Dong Yue Powertrain (SGM DYPT). These three joint ventures are jointly
held by SGM (50%), SAIC (25%) and us (25%). The four joint ventures (SGM Group) are engaged in the production, import, and sale
of a comprehensive range of products under the brands of Buick, Chevrolet and Cadillac.
SGMW produces mini-commercial vehicles and passenger cars utilizing local architectures under the Wuling, Chevrolet and
Baojun brands. FAW-GM, of which we own 50% and China FAW Group Corporation (FAW) owns 50%, produces light commercial
vehicles under the Jiefang brand and medium vans under the FAW brand. Our joint venture agreements allow for significant rights as
a member.
SAIC, one of our joint venture partners, currently produces vehicles under its own brands for sale in the Chinese market. At present
vehicles that SAIC produces primarily serve markets that are different from markets served by our joint ventures.
PATAC is our China-based engineering and technical joint venture with SAIC. Shanghai OnStar is our joint venture with SAIC that
provides Chinese customers with a wide array of vehicle safety and information services. Used Car JV is our joint venture with SAIC
that will cooperate with current distributors of SGM products in the establishment of dedicated used car sales and service facilities
across China.
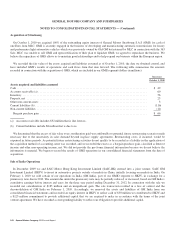
In February 2010 we sold a 1% ownership interest in SGM to SAIC-HK, reducing our ownership interest to 49%. The sale of the
1% ownership interest to SAIC was predicated on our ability to work with SAIC to obtain a $400 million line of credit from a
commercial bank to us. We also received a call option to repurchase the 1% which is contingently exercisable based on events which
we do not unilaterally control. As part of the loan arrangement SAIC provided a commitment whereby, in the event of default, SAIC
will purchase the ownership interest in SGM that we pledged as collateral for the loan. We recorded an insignificant gain on this
transaction in the year ended December 31, 2010.
In November 2010 we purchased an additional 10% interest in SGMW from the Liuzhou Wuling Motors Co., Ltd. and Liuzhou
Mini Vehicles Factory, collectively the Wuling Group, for cash of $52 million plus an agreement to provide technical services to the
Wuling Group for a period of three years. As a result of this transaction, we own 44%, SAIC owns 50.1% and certain Liuzhou
investors own 5.9% of the outstanding stock of SGMW. The fair value of the additional 10% interest in SGMW was $394 million at
the date of the transaction, as determined using a discounted cash flow methodology. The difference between the cash consideration
and the fair value of the 10% interest in SGMW is being deferred and amortized over the three year period we will provide technical
services to the Wuling Group. During the year ended December 31, 2010 $14 million was amortized and recorded in Interest income
and other non-operating income, net.
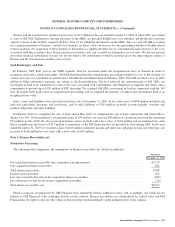
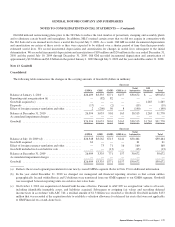
Investment in and Summarized Financial Data of Nonconsolidated Affiliates
The following table summarizes the carrying amount of investments in significant nonconsolidated affiliates (dollars in millions):
Successor
December 31, 2010 December 31, 2009
Carrying amount of investment in China JVs .......................................... $6,133 $5,648
Carrying amount of investment in New Delphi ........................................ 2,043 1,908
Carrying amount of other investments ............................................... 353 380
Total equity in net assets of nonconsolidated affiliates .................................. $8,529 $7,936
General Motors Company 2010 Annual Report 171