General Motors 2010 Annual Report Download - page 180
Download and view the complete annual report
Please find page 180 of the 2010 General Motors annual report below. You can navigate through the pages in the report by either clicking on the pages listed below, or by using the keyword search tool below to find specific information within the annual report.-
 1
1 -
2
-
3
-
4
-
5
-
6
-
7
-
8
-
9
-
10
-
11
-
12
-
13
-
14
-
15
-
16
-
17
-
18
-
19
-
20
-
21
-
22
-
23
-
24
-
25
-
26
-
27
-
28
-
29
-
30
-
31
-
32
-
33
-
34
-
35
-
36
-
37
-
38
-
39
-
40
-
41
-
42
-
43
-
44
-
45
-
46
-
47
-
48
-
49
-
50
-
51
-
52
-
53
-
54
-
55
-
56
-
57
-
58
-
59
-
60
-
61
-
62
-
63
-
64
-
65
-
66
-
67
-
68
-
69
-
70
-
71
-
72
-
73
-
74
-
75
-
76
-
77
-
78
-
79
-
80
-
81
-
82
-
83
-
84
-
85
-
86
-
87
-
88
-
89
-
90
-
91
-
92
-
93
-
94
-
95
-
96
-
97
-
98
-
99
-
100
-
101
-
102
-
103
-
104
-
105
-
106
-
107
-
108
-
109
-
110
-
111
-
112
-
113
-
114
-
115
-
116
-
117
-
118
-
119
-
120
-
121
-
122
-
123
-
124
-
125
-
126
-
127
-
128
-
129
-
130
-
131
-
132
-
133
-
134
-
135
-
136
-
137
-
138
-
139
-
140
-
141
-
142
-
143
-
144
-
145
-
146
-
147
-
148
-
149
-
150
-
151
-
152
-
153
-
154
-
155
-
156
-
157
-
158
-
159
-
160
-
161
-
162
-
163
-
164
-
165
-
166
-
167
-
168
-
169
-
 170
170 -
 171
171 -
 172
172 -
 173
173 -
 174
174 -
 175
175 -
 176
176 -
 177
177 -
 178
178 -
 179
179 -
 180
180 -
 181
181 -
 182
182 -
 183
183 -
 184
184 -
 185
185 -
 186
186 -
 187
187 -
 188
188 -
 189
189 -
 190
190 -
191
-
192
-
193
-
194
-
195
-
196
-
197
-
198
-
199
-
200
-
201
-
202
-
203
-
204
-
205
-
206
-
207
-
208
-
209
-
210
-
211
-
212
-
213
-
214
-
215
-
216
-
217
-
218
-
219
-
220
-
221
-
222
-
223
-
224
-
225
-
226
-
227
-
228
-
229
-
230
-
231
-
232
-
233
-
234
-
235
-
236
-
237
-
238
-
239
-
240
-
241
-
242
-
243
-
244
-
245
-
246
-
247
-
248
-
249
-
250
-
251
-
252
-
253
-
254
-
255
-
256
-
257
-
258
-
259
-
260
-
261
-
262
-
263
-
264
-
265
-
266
-
267
-
268
-
269
-
270
-
271
-
272
-
273
-
274
-
275
-
276
-
277
-
278
-
279
-
280
-
281
-
282
-
283
-
284
-
285
-
286
-
287
-
288
-
289
-
290
 |
 |

GENERAL MOTORS COMPANY AND SUBSIDIARIES
NOTES TO CONSOLIDATED FINANCIAL STATEMENTS — (Continued)
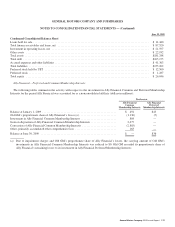
(d) We recorded Goodwill of $30.5 billion upon application of fresh-start reporting. If all identifiable assets and liabilities had been
recorded at fair value upon application of fresh-start reporting, no goodwill would have resulted. However, when applying fresh-
start reporting, certain accounts, primarily employee benefit plan and income tax related, were recorded at amounts determined
under specific U.S. GAAP rather than fair value and the difference between the U.S. GAAP and fair value amounts gave rise to
goodwill, which is a residual. Our employee benefit related accounts were recorded in accordance with ASC 712 and 715 and
deferred income taxes were recorded in accordance with ASC 740. Further, we recorded valuation allowances against certain of
our deferred tax assets, which under ASC 852 also resulted in Goodwill. These valuation allowances were due in part to Old
GM’s history of recurring operating losses, and our projections at the 363 Sale date of continued near-term operating losses in
certain jurisdictions. While the 363 Sale constituted a significant restructuring that eliminated many operating and financing
costs, Old GM had undertaken significant restructurings in the past that failed to return certain jurisdictions to profitability. At
the 363 Sale date, we concluded that there was significant uncertainty as to whether the recent restructuring actions would return
these jurisdictions to sustained profitability, thereby necessitating the establishment of a valuation allowance against certain
deferred tax assets. None of the goodwill from this transaction is deductible for tax purposes.
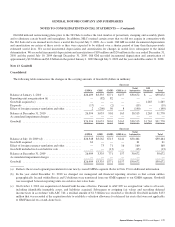
In the three months ended December 31, 2010 and 2009 we performed our annual goodwill impairment analysis of our reporting
units at October 1, 2010 and 2009, and in the three months ended June 30, 2010 an event-driven impairment analysis for GME which
resulted in no goodwill impairment charges.
The valuation methodologies utilized to perform our goodwill impairment testing were consistent with those used in our application
of fresh-start reporting on July 10, 2009, as discussed in Note 2, and in any subsequent annual or event-driven impairment tests and
resulted in Level 3 measures.
Our fair value estimate assumes the achievement of the future financial results contemplated in our forecasted cash flows, and there
can be no assurance that we will realize that value. The estimates and assumptions used are subject to significant uncertainties, many
of which are beyond our control, and there is no assurance that anticipated financial results will be achieved.
Refer to Note 26 for additional information on goodwill impairments in prior periods.
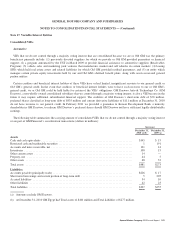
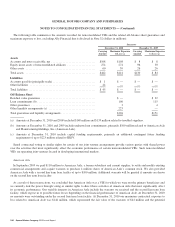
Note 14. Intangible Assets, net
Automotive
The following table summarizes the components of Intangible assets, net (dollars in millions):
Successor
December 31, 2010 December 31, 2009
Weighted-
Average
Remaining
Amortization
Period
(Years)
Gross
Carrying
Amount
Accumulated
Amortization
Net
Carrying
Amount
Weighted-
Average
Remaining
Amortization
Period
(Years)
Gross
Carrying
Amount
Accumulated
Amortization
Net
Carrying
Amount
Technology and intellectual property ......... 3 $ 7,751 $3,650 $ 4,101 4 $ 7,741 $1,460 $ 6,281
Brands ................................. 37 5,439 222 5,217 38 5,508 72 5,436
Dealer network and customer relationships .... 20 2,172 199 1,973 21 2,205 67 2,138
Favorable contracts ....................... 26 526 120 406 24 542 39 503
Other .................................. 2 19 9 10 3 17 3 14
Total amortizing intangible assets ........... 21 15,907 4,200 11,707 20 16,013 1,641 14,372
Non amortizing in process research and
development .......................... 175 — 175 175 — 175
Total intangible assets ..................... $16,082 $4,200 $11,882 $16,188 $1,641 $14,547
178 General Motors Company 2010 Annual Report