General Motors 2010 Annual Report Download - page 248
Download and view the complete annual report
Please find page 248 of the 2010 General Motors annual report below. You can navigate through the pages in the report by either clicking on the pages listed below, or by using the keyword search tool below to find specific information within the annual report.-
 1
1 -
2
-
3
-
4
-
5
-
6
-
7
-
8
-
9
-
10
-
11
-
12
-
13
-
14
-
15
-
16
-
17
-
18
-
19
-
20
-
21
-
22
-
23
-
24
-
25
-
26
-
27
-
28
-
29
-
30
-
31
-
32
-
33
-
34
-
35
-
36
-
37
-
38
-
39
-
40
-
41
-
42
-
43
-
44
-
45
-
46
-
47
-
48
-
49
-
50
-
51
-
52
-
53
-
54
-
55
-
56
-
57
-
58
-
59
-
60
-
61
-
62
-
63
-
64
-
65
-
66
-
67
-
68
-
69
-
70
-
71
-
72
-
73
-
74
-
75
-
76
-
77
-
78
-
79
-
80
-
81
-
82
-
83
-
84
-
85
-
86
-
87
-
88
-
89
-
90
-
91
-
92
-
93
-
94
-
95
-
96
-
97
-
98
-
99
-
100
-
101
-
102
-
103
-
104
-
105
-
106
-
107
-
108
-
109
-
110
-
111
-
112
-
113
-
114
-
115
-
116
-
117
-
118
-
119
-
120
-
121
-
122
-
123
-
124
-
125
-
126
-
127
-
128
-
129
-
130
-
131
-
132
-
133
-
134
-
135
-
136
-
137
-
138
-
139
-
140
-
141
-
142
-
143
-
144
-
145
-
146
-
147
-
148
-
149
-
150
-
151
-
152
-
153
-
154
-
155
-
156
-
157
-
158
-
159
-
160
-
161
-
162
-
163
-
164
-
165
-
166
-
167
-
168
-
169
-
170
-
171
-
172
-
173
-
174
-
175
-
176
-
177
-
178
-
179
-
180
-
181
-
182
-
183
-
184
-
185
-
186
-
187
-
188
-
189
-
190
-
191
-
192
-
193
-
194
-
195
-
196
-
197
-
198
-
199
-
200
-
201
-
202
-
203
-
204
-
205
-
206
-
207
-
208
-
209
-
210
-
211
-
212
-
213
-
214
-
215
-
216
-
217
-
218
-
219
-
220
-
221
-
222
-
223
-
224
-
225
-
226
-
227
-
228
-
229
-
230
-
231
-
232
-
233
-
234
-
235
-
236
-
237
-
 238
238 -
 239
239 -
 240
240 -
 241
241 -
 242
242 -
 243
243 -
 244
244 -
 245
245 -
 246
246 -
 247
247 -
 248
248 -
 249
249 -
 250
250 -
 251
251 -
 252
252 -
 253
253 -
 254
254 -
 255
255 -
 256
256 -
 257
257 -
 258
258 -
259
-
260
-
261
-
262
-
263
-
264
-
265
-
266
-
267
-
268
-
269
-
270
-
271
-
272
-
273
-
274
-
275
-
276
-
277
-
278
-
279
-
280
-
281
-
282
-
283
-
284
-
285
-
286
-
287
-
288
-
289
-
290
 |
 |

GENERAL MOTORS COMPANY AND SUBSIDIARIES
NOTES TO CONSOLIDATED FINANCIAL STATEMENTS — (Continued)
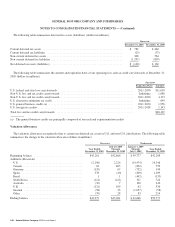
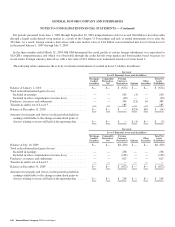
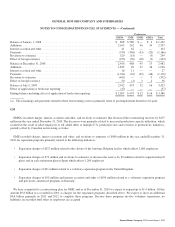
For periods presented from June 1, 2009 through September 30, 2010 nonperformance risk for us and Old GM was not observable
through a liquid credit default swap market as a result of the Chapter 11 Proceedings and lack of traded instruments for us after the
363 Sale. As a result, foreign currency derivatives with a fair market value of $1.6 billion were transferred into Level 3 from Level 2
in the period January 1, 2009 through July 9, 2009.
In the three months ended March 31, 2009 Old GM determined the credit profile of certain foreign subsidiaries was equivalent to
Old GM’s nonperformance risk which was observable through the credit default swap market and bond market based on prices for
recent trades. Foreign currency derivatives with a fair value of $2.1 billion were transferred from Level 3 into Level 2.
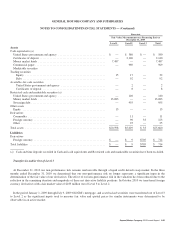
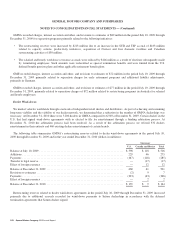
The following tables summarize the activity for financial instruments classified in Level 3 (dollars in millions):
Successor
Level 3 Financial Assets and (Liabilities)
Mortgage-
backed
Securities
Commodity
Derivatives,
Net
Foreign
Currency
Derivatives Options
Other
Securities
Total Net
Assets
(Liabilities)
Balance at January 1, 2010 ............................... $— $— $ (672) $ — $— $ (672)
Total realized/unrealized gains (losses)
Included in earnings .................................. — — 103 (3) — 100
Included in other comprehensive income (loss) ............. — — (10) — — (10)
Purchases, issuances and settlements ....................... — — 394 (21) 10 383
Transfer in and/or out of Level 3 .......................... — — 185 — — 185
Balance at December 31, 2010 ............................ $— $— $ — $(24) $10 $ (14)
Amount of total gains and (losses) in the period included in
earnings attributable to the change in unrealized gains or
(losses) relating to assets still held at the reporting date ...... $— $— $ — $ (3) $— $ (3)
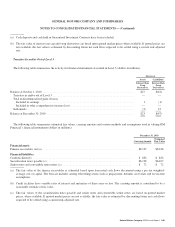
Successor
Level 3 Financial Assets and (Liabilities)
Mortgage-
backed
Securities
Commodity
Derivatives,
Net
Foreign
Currency
Derivatives Options
Other
Securities
Total Net
Assets
(Liabilities)
Balance at July 10, 2009 ................................. $— $— $(1,430) $ — $— $(1,430)
Total realized/unrealized gains (losses)
Included in earnings .................................. — — 238 — — 238
Included in other comprehensive income (loss) ............. — — (103) — — (103)
Purchases, issuances and settlements ....................... — — 623 — — 623
Transfer in and/or out of Level 3 .......................... — — — — — —
Balance at December 31, 2009 ............................ $— $— $ (672) $ — $— $ (672)
Amount of total gains and (losses) in the period included in
earnings attributable to the change in unrealized gains or
(losses) relating to assets still held at the reporting date ...... $— $— $ 214 $— $— $ 214
246 General Motors Company 2010 Annual Report