General Motors 2010 Annual Report Download - page 211
Download and view the complete annual report
Please find page 211 of the 2010 General Motors annual report below. You can navigate through the pages in the report by either clicking on the pages listed below, or by using the keyword search tool below to find specific information within the annual report.-
 1
1 -
2
-
3
-
4
-
5
-
6
-
7
-
8
-
9
-
10
-
11
-
12
-
13
-
14
-
15
-
16
-
17
-
18
-
19
-
20
-
21
-
22
-
23
-
24
-
25
-
26
-
27
-
28
-
29
-
30
-
31
-
32
-
33
-
34
-
35
-
36
-
37
-
38
-
39
-
40
-
41
-
42
-
43
-
44
-
45
-
46
-
47
-
48
-
49
-
50
-
51
-
52
-
53
-
54
-
55
-
56
-
57
-
58
-
59
-
60
-
61
-
62
-
63
-
64
-
65
-
66
-
67
-
68
-
69
-
70
-
71
-
72
-
73
-
74
-
75
-
76
-
77
-
78
-
79
-
80
-
81
-
82
-
83
-
84
-
85
-
86
-
87
-
88
-
89
-
90
-
91
-
92
-
93
-
94
-
95
-
96
-
97
-
98
-
99
-
100
-
101
-
102
-
103
-
104
-
105
-
106
-
107
-
108
-
109
-
110
-
111
-
112
-
113
-
114
-
115
-
116
-
117
-
118
-
119
-
120
-
121
-
122
-
123
-
124
-
125
-
126
-
127
-
128
-
129
-
130
-
131
-
132
-
133
-
134
-
135
-
136
-
137
-
138
-
139
-
140
-
141
-
142
-
143
-
144
-
145
-
146
-
147
-
148
-
149
-
150
-
151
-
152
-
153
-
154
-
155
-
156
-
157
-
158
-
159
-
160
-
161
-
162
-
163
-
164
-
165
-
166
-
167
-
168
-
169
-
170
-
171
-
172
-
173
-
174
-
175
-
176
-
177
-
178
-
179
-
180
-
181
-
182
-
183
-
184
-
185
-
186
-
187
-
188
-
189
-
190
-
191
-
192
-
193
-
194
-
195
-
196
-
197
-
198
-
199
-
200
-
 201
201 -
 202
202 -
 203
203 -
 204
204 -
 205
205 -
 206
206 -
 207
207 -
 208
208 -
 209
209 -
 210
210 -
 211
211 -
 212
212 -
 213
213 -
 214
214 -
 215
215 -
 216
216 -
 217
217 -
 218
218 -
 219
219 -
 220
220 -
 221
221 -
222
-
223
-
224
-
225
-
226
-
227
-
228
-
229
-
230
-
231
-
232
-
233
-
234
-
235
-
236
-
237
-
238
-
239
-
240
-
241
-
242
-
243
-
244
-
245
-
246
-
247
-
248
-
249
-
250
-
251
-
252
-
253
-
254
-
255
-
256
-
257
-
258
-
259
-
260
-
261
-
262
-
263
-
264
-
265
-
266
-
267
-
268
-
269
-
270
-
271
-
272
-
273
-
274
-
275
-
276
-
277
-
278
-
279
-
280
-
281
-
282
-
283
-
284
-
285
-
286
-
287
-
288
-
289
-
290
 |
 |

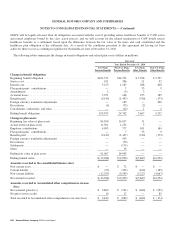
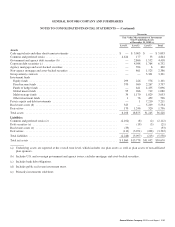
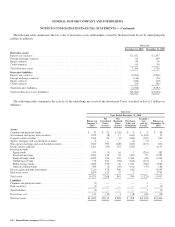
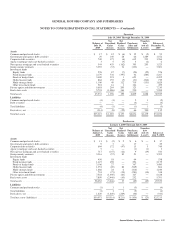
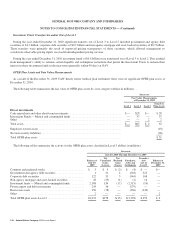
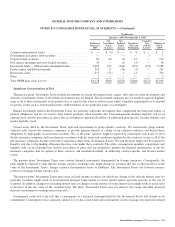
GENERAL MOTORS COMPANY AND SUBSIDIARIES
NOTES TO CONSOLIDATED FINANCIAL STATEMENTS — (Continued)
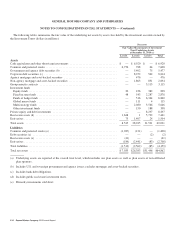
Successor
Fair Value Measurements of U.S. Plan Assets
at December 31, 2009
Fair Value Measurements of Non-U.S.
Plan Assets at December 31, 2009
Level 1 Level 2 Level 3
Total U.S.
Plan Assets Level 1 Level 2 Level 3
Total
Non-U.S.
Plan Assets
Total U.S.
and Non-
U.S. Plan
Assets
Assets
Direct investments
Cash equivalents and other short-term
investments .................... $ — $ — $ — $ — $ 137 $ 463 $ — $ 600 $ 600
Common and preferred stocks ....... — — — — 3,002 56 — 3,058 3,058
Government and agency debt securities
(a) ........................... — — — — 93 4,136 65 4,294 4,294
Corporate debt securities (b) ......... — — — — 2 483 109 594 594
Agency mortgage and asset-backed
securities ...................... — — — — — 62 7 69 69
Non-agency mortgage and asset-backed
securities ...................... — — — — — 42 16 58 58
Private equity and debt investments . . . — — — — — — 110 110 110
Real estate assets .................. — — — — 14 — 825 839 839
Derivatives ...................... — — — — — 66 — 66 66
Total direct investments ............ — — — — 3,248 5,308 1,132 9,688 9,688
Investment funds
Cash equivalent funds .............. — — — — 19 4 — 23 23
Equity funds ..................... — 14,495 — 14,495 1 2,575 75 2,651 17,146
Fixed income funds ................ — 9,643 4,221 13,864 — 1,012 — 1,012 14,876
Multi-strategy funds ............... — 2,337 — 2,337 — 18 — 18 2,355
Real estate funds .................. — 916 — 916 — 35 217 252 1,168
Other investment funds (c) .......... — — — — — 8 95 103 103
Total investment funds ............. — 27,391 4,221 31,612 20 3,652 387 4,059 35,671
Other ............................. — — — — — 206 — 206 206
Total assets before Investment Trusts . . . . — 27,391 4,221 31,612 3,268 9,166 1,519 13,953 45,565
Liabilities
Derivatives ........................ — — — — — (43) — (43) (43)
Total liabilities before Investment
Trusts ......................... — — — — — (43) — (43) (43)
Net assets before Investment Trusts ..... $ — $27,391 $4,221 31,612 $3,268 $9,123 $1,519 13,910 45,522
Investment Trusts (d) ................ 53,043 — 53,043
Total net assets and Investment
Trusts ......................... 84,655 13,910 98,565
Other plan assets and liabilities (e) ...... (155) 117 (38)
Net plan assets ..................... $84,500 $14,027 $98,527
General Motors Company 2010 Annual Report 209