General Motors 2010 Annual Report Download - page 70
Download and view the complete annual report
Please find page 70 of the 2010 General Motors annual report below. You can navigate through the pages in the report by either clicking on the pages listed below, or by using the keyword search tool below to find specific information within the annual report.-
 1
1 -
2
-
3
-
4
-
5
-
6
-
7
-
8
-
9
-
10
-
11
-
12
-
13
-
14
-
15
-
16
-
17
-
18
-
19
-
20
-
21
-
22
-
23
-
24
-
25
-
26
-
27
-
28
-
29
-
30
-
31
-
32
-
33
-
34
-
35
-
36
-
37
-
38
-
39
-
40
-
41
-
42
-
43
-
44
-
45
-
46
-
47
-
48
-
49
-
50
-
51
-
52
-
53
-
54
-
55
-
56
-
57
-
58
-
59
-
 60
60 -
 61
61 -
 62
62 -
 63
63 -
 64
64 -
 65
65 -
 66
66 -
 67
67 -
 68
68 -
 69
69 -
 70
70 -
 71
71 -
 72
72 -
 73
73 -
 74
74 -
 75
75 -
 76
76 -
 77
77 -
 78
78 -
 79
79 -
 80
80 -
81
-
82
-
83
-
84
-
85
-
86
-
87
-
88
-
89
-
90
-
91
-
92
-
93
-
94
-
95
-
96
-
97
-
98
-
99
-
100
-
101
-
102
-
103
-
104
-
105
-
106
-
107
-
108
-
109
-
110
-
111
-
112
-
113
-
114
-
115
-
116
-
117
-
118
-
119
-
120
-
121
-
122
-
123
-
124
-
125
-
126
-
127
-
128
-
129
-
130
-
131
-
132
-
133
-
134
-
135
-
136
-
137
-
138
-
139
-
140
-
141
-
142
-
143
-
144
-
145
-
146
-
147
-
148
-
149
-
150
-
151
-
152
-
153
-
154
-
155
-
156
-
157
-
158
-
159
-
160
-
161
-
162
-
163
-
164
-
165
-
166
-
167
-
168
-
169
-
170
-
171
-
172
-
173
-
174
-
175
-
176
-
177
-
178
-
179
-
180
-
181
-
182
-
183
-
184
-
185
-
186
-
187
-
188
-
189
-
190
-
191
-
192
-
193
-
194
-
195
-
196
-
197
-
198
-
199
-
200
-
201
-
202
-
203
-
204
-
205
-
206
-
207
-
208
-
209
-
210
-
211
-
212
-
213
-
214
-
215
-
216
-
217
-
218
-
219
-
220
-
221
-
222
-
223
-
224
-
225
-
226
-
227
-
228
-
229
-
230
-
231
-
232
-
233
-
234
-
235
-
236
-
237
-
238
-
239
-
240
-
241
-
242
-
243
-
244
-
245
-
246
-
247
-
248
-
249
-
250
-
251
-
252
-
253
-
254
-
255
-
256
-
257
-
258
-
259
-
260
-
261
-
262
-
263
-
264
-
265
-
266
-
267
-
268
-
269
-
270
-
271
-
272
-
273
-
274
-
275
-
276
-
277
-
278
-
279
-
280
-
281
-
282
-
283
-
284
-
285
-
286
-
287
-
288
-
289
-
290
 |
 |

GENERAL MOTORS COMPANY AND SUBSIDIARIES
Year Ended
December 31, 2010
Year Ended
December 31, 2009
Year Ended
December 31, 2008
GM
GM
asa%of
Industry
Combined GM
and Old GM
Combined GM
and Old GM
asa%of
Industry Old GM
Old GM
asa%of
Industry
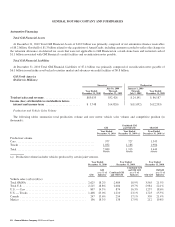
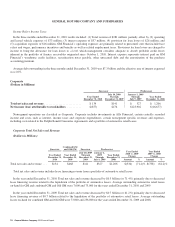
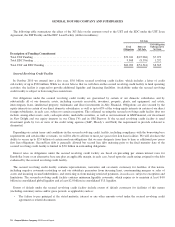
Vehicle sales (a)(b)(c)
Total GMSA .......................................... 1,026 19.9% 872 20.0% 920 20.7%
Brazil ............................................... 658 18.7% 596 19.0% 549 19.5%
Argentina ............................................ 109 16.3% 79 15.2% 95 15.5%
Colombia ............................................ 85 33.6% 67 36.1% 80 36.3%
Ecuador ............................................. 53 40.8% 40 43.3% 48 42.2%
Venezuela ............................................ 51 40.6% 49 36.1% 90 33.2%
(a) Vehicle sales primarily represent estimated sales to the ultimate customer. In countries where end customer data is not readily
available other data sources, such as wholesale volumes, are used to estimate vehicle sales.
(b) Vehicle sales data may include rounding differences.
(c) Certain fleet sales that are accounted for as operating leases are included in vehicle sales at the time of delivery to the daily rental
car companies.
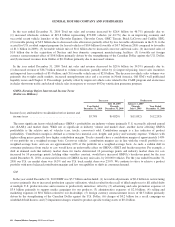
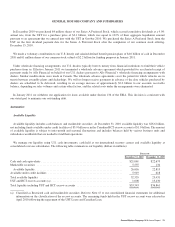
GMSA Total Net Sales and Revenue
(Dollars in Millions)
Successor
Combined GM
and Old GM Successor Predecessor
Year Ended
2010 vs. 2009 Change
Year Ended
2009 vs. 2008 Change
Year Ended
December 31,
2010
Year Ended
December 31,
2009
July 10, 2009
Through
December 31,
2009
January 1,
2009
Through
July 9, 2009
Year Ended
December 31,
2008 Amount % Amount %
Total net sales and
revenue ............. $15,379 $13,135 $7,399 $5,736 $14,522 $2,244 17.1% $(1,387) (9.6)%
In the year ended December 31, 2010 Total net sales and revenue increased by $2.2 billion (or 17.1%) primarily due to:
(1) increased wholesale volumes of $2.2 billion representing 170,000 vehicles (or 19.1%) primarily in Brazil by 72,000 vehicles or
(11.7%), in Argentina by 32,000 vehicles (or 41.4%) and in Colombia by 21,000 vehicles (or 32.9%) driven by launches of the
Chevrolet Cruze and Chevrolet Spark throughout the region; (2) favorable net foreign currency translation effect of $1.0 billion,
primarily due to the strengthening of major currencies in 2010 against the U.S. Dollar such as the Brazilian Real and Colombian Peso;
(3) favorable vehicle pricing effect of $0.3 billion, primarily in Venezuela driven by the hyperinflationary economy; partially offset by
(4) devaluation of the BsF in Venezuela of $0.9 billion; and (5) unfavorable vehicle mix of $0.4 billion driven by increased sales of
the Chevrolet Spark and Chevrolet Aveo and decreased sales of the Chevrolet Meriva, Vectra and S-10.
In the year ended December 31, 2009 Total net sales and revenue decreased by $1.4 billion (or 9.6%) due to: (1) decreased
wholesale volumes of $2.2 billion representing 30,000 vehicles (or 3.3%) primarily in Venezuela by 37,000 vehicles (or 44.1%), in
Argentina by 19,000 vehicles (or 19.8%) and in Colombia by 13,000 vehicles (or 16.6%); partially offset by (2) favorable pricing
effect of $0.4 billion primarily due to price increases in Venezuela driven by the hyperinflationary economy; and (3) increased
wholesale volumes in Brazil of $0.2 billion representing 56,000 vehicles (or 10.0%).
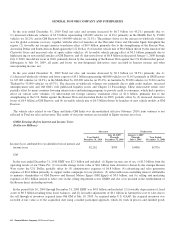
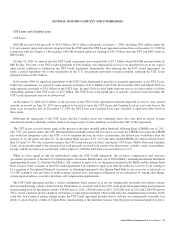
GMSA Earnings Before Interest and Income Taxes
(Dollars in Millions)
Successor Predecessor
Year Ended
December 31, 2010
July 10, 2009
Through
December 31, 2009
January 1, 2009
Through
July 9, 2009
Year Ended
December 31, 2008
Income (loss) attributable to stockholders before interest and
income taxes ........................................ $818 $417 $(454) $1,076
68 General Motors Company 2010 Annual Report