General Motors 2010 Annual Report Download - page 216
Download and view the complete annual report
Please find page 216 of the 2010 General Motors annual report below. You can navigate through the pages in the report by either clicking on the pages listed below, or by using the keyword search tool below to find specific information within the annual report.-
 1
1 -
2
-
3
-
4
-
5
-
6
-
7
-
8
-
9
-
10
-
11
-
12
-
13
-
14
-
15
-
16
-
17
-
18
-
19
-
20
-
21
-
22
-
23
-
24
-
25
-
26
-
27
-
28
-
29
-
30
-
31
-
32
-
33
-
34
-
35
-
36
-
37
-
38
-
39
-
40
-
41
-
42
-
43
-
44
-
45
-
46
-
47
-
48
-
49
-
50
-
51
-
52
-
53
-
54
-
55
-
56
-
57
-
58
-
59
-
60
-
61
-
62
-
63
-
64
-
65
-
66
-
67
-
68
-
69
-
70
-
71
-
72
-
73
-
74
-
75
-
76
-
77
-
78
-
79
-
80
-
81
-
82
-
83
-
84
-
85
-
86
-
87
-
88
-
89
-
90
-
91
-
92
-
93
-
94
-
95
-
96
-
97
-
98
-
99
-
100
-
101
-
102
-
103
-
104
-
105
-
106
-
107
-
108
-
109
-
110
-
111
-
112
-
113
-
114
-
115
-
116
-
117
-
118
-
119
-
120
-
121
-
122
-
123
-
124
-
125
-
126
-
127
-
128
-
129
-
130
-
131
-
132
-
133
-
134
-
135
-
136
-
137
-
138
-
139
-
140
-
141
-
142
-
143
-
144
-
145
-
146
-
147
-
148
-
149
-
150
-
151
-
152
-
153
-
154
-
155
-
156
-
157
-
158
-
159
-
160
-
161
-
162
-
163
-
164
-
165
-
166
-
167
-
168
-
169
-
170
-
171
-
172
-
173
-
174
-
175
-
176
-
177
-
178
-
179
-
180
-
181
-
182
-
183
-
184
-
185
-
186
-
187
-
188
-
189
-
190
-
191
-
192
-
193
-
194
-
195
-
196
-
197
-
198
-
199
-
200
-
201
-
202
-
203
-
204
-
205
-
 206
206 -
 207
207 -
 208
208 -
 209
209 -
 210
210 -
 211
211 -
 212
212 -
 213
213 -
 214
214 -
 215
215 -
 216
216 -
 217
217 -
 218
218 -
 219
219 -
 220
220 -
 221
221 -
 222
222 -
 223
223 -
 224
224 -
 225
225 -
 226
226 -
227
-
228
-
229
-
230
-
231
-
232
-
233
-
234
-
235
-
236
-
237
-
238
-
239
-
240
-
241
-
242
-
243
-
244
-
245
-
246
-
247
-
248
-
249
-
250
-
251
-
252
-
253
-
254
-
255
-
256
-
257
-
258
-
259
-
260
-
261
-
262
-
263
-
264
-
265
-
266
-
267
-
268
-
269
-
270
-
271
-
272
-
273
-
274
-
275
-
276
-
277
-
278
-
279
-
280
-
281
-
282
-
283
-
284
-
285
-
286
-
287
-
288
-
289
-
290
 |
 |

GENERAL MOTORS COMPANY AND SUBSIDIARIES
NOTES TO CONSOLIDATED FINANCIAL STATEMENTS — (Continued)
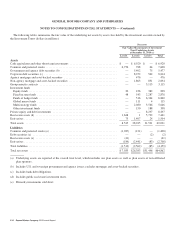
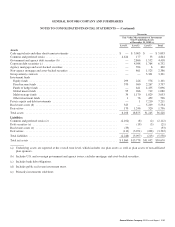
The following tables summarize the fair value of the underlying net assets by asset class held by the investment accounts owned by
the Investment Trusts (dollars in millions):
Successor
Fair Value Measurements of Investment
Trust Underlying Assets
at December 31, 2010 (a)
Level 1 Level 2 Level 3 Total
Assets
Cash equivalents and other short-term investments ................................. $ — $ 6,920 $ — $ 6,920
Common and preferred stocks .................................................. 6,756 788 64 7,608
Government and agency debt securities (b) ....................................... — 5,402 75 5,477
Corporate debt securities (c) ................................................... — 8,252 562 8,814
Agency mortgage and asset-backed securities ..................................... — 476 — 476
Non-agency mortgage and asset-backed securities .................................. — 1,863 831 2,694
Group annuity contracts ...................................................... — — 3,115 3,115
Investment funds
Equity funds .............................................................. 20 436 382 838
Fixed income funds ........................................................ 48 543 2,287 2,878
Funds of hedge funds ....................................................... — 516 6,344 6,860
Global macro funds ........................................................ — 111 4 115
Multi-strategy funds ....................................................... — 2,080 3,566 5,646
Other investment funds ..................................................... — 150 188 338
Private equity and debt investments ............................................. — — 8,297 8,297
Real estate assets (d) ......................................................... 1,648 1 5,792 7,441
Derivatives ................................................................. 73 1,407 24 1,504
Total assets ................................................................ 8,545 28,945 31,531 69,021
Liabilities
Common and preferred stocks (e) ............................................... (1,287) (121) — (1,408)
Debt securities (e) ........................................................... — — (2) (2)
Real estate assets (e) ......................................................... (41) — — (41)
Derivatives ................................................................. (184) (2,441) (83) (2,708)
Total liabilities .............................................................. (1,512) (2,562) (85) (4,159)
Total net assets ............................................................. $7,033 $26,383 $31,446 $64,862
(a) Underlying assets are reported at the overall trust level, which includes our plan assets as well as plan assets of non-affiliated
plan sponsors.
(b) Includes U.S. and sovereign government and agency issues; excludes mortgage and asset-backed securities.
(c) Includes bank debt obligations.
(d) Includes public real estate investment trusts.
(e) Primarily investments sold short.
214 General Motors Company 2010 Annual Report