General Motors 2010 Annual Report Download - page 140
Download and view the complete annual report
Please find page 140 of the 2010 General Motors annual report below. You can navigate through the pages in the report by either clicking on the pages listed below, or by using the keyword search tool below to find specific information within the annual report.-
 1
1 -
2
-
3
-
4
-
5
-
6
-
7
-
8
-
9
-
10
-
11
-
12
-
13
-
14
-
15
-
16
-
17
-
18
-
19
-
20
-
21
-
22
-
23
-
24
-
25
-
26
-
27
-
28
-
29
-
30
-
31
-
32
-
33
-
34
-
35
-
36
-
37
-
38
-
39
-
40
-
41
-
42
-
43
-
44
-
45
-
46
-
47
-
48
-
49
-
50
-
51
-
52
-
53
-
54
-
55
-
56
-
57
-
58
-
59
-
60
-
61
-
62
-
63
-
64
-
65
-
66
-
67
-
68
-
69
-
70
-
71
-
72
-
73
-
74
-
75
-
76
-
77
-
78
-
79
-
80
-
81
-
82
-
83
-
84
-
85
-
86
-
87
-
88
-
89
-
90
-
91
-
92
-
93
-
94
-
95
-
96
-
97
-
98
-
99
-
100
-
101
-
102
-
103
-
104
-
105
-
106
-
107
-
108
-
109
-
110
-
111
-
112
-
113
-
114
-
115
-
116
-
117
-
118
-
119
-
120
-
121
-
122
-
123
-
124
-
125
-
126
-
127
-
128
-
129
-
 130
130 -
 131
131 -
 132
132 -
 133
133 -
 134
134 -
 135
135 -
 136
136 -
 137
137 -
 138
138 -
 139
139 -
 140
140 -
 141
141 -
 142
142 -
 143
143 -
 144
144 -
 145
145 -
 146
146 -
 147
147 -
 148
148 -
 149
149 -
 150
150 -
151
-
152
-
153
-
154
-
155
-
156
-
157
-
158
-
159
-
160
-
161
-
162
-
163
-
164
-
165
-
166
-
167
-
168
-
169
-
170
-
171
-
172
-
173
-
174
-
175
-
176
-
177
-
178
-
179
-
180
-
181
-
182
-
183
-
184
-
185
-
186
-
187
-
188
-
189
-
190
-
191
-
192
-
193
-
194
-
195
-
196
-
197
-
198
-
199
-
200
-
201
-
202
-
203
-
204
-
205
-
206
-
207
-
208
-
209
-
210
-
211
-
212
-
213
-
214
-
215
-
216
-
217
-
218
-
219
-
220
-
221
-
222
-
223
-
224
-
225
-
226
-
227
-
228
-
229
-
230
-
231
-
232
-
233
-
234
-
235
-
236
-
237
-
238
-
239
-
240
-
241
-
242
-
243
-
244
-
245
-
246
-
247
-
248
-
249
-
250
-
251
-
252
-
253
-
254
-
255
-
256
-
257
-
258
-
259
-
260
-
261
-
262
-
263
-
264
-
265
-
266
-
267
-
268
-
269
-
270
-
271
-
272
-
273
-
274
-
275
-
276
-
277
-
278
-
279
-
280
-
281
-
282
-
283
-
284
-
285
-
286
-
287
-
288
-
289
-
290
 |
 |

GENERAL MOTORS COMPANY AND SUBSIDIARIES
NOTES TO CONSOLIDATED FINANCIAL STATEMENTS — (Continued)
primarily utilized for certain assets related to land, buildings and land improvements, leasehold interests, and the majority of
our machinery and equipment and tooling. Economic obsolescence represents a loss in value due to unfavorable external
conditions such as the economics of our industry and was a factor in establishing fair value. Our machinery, equipment and
special tools amounts, determined under the cost approach, were adjusted for economic obsolescence. Due to the downturn in
the automotive industry, significant excess capacity exists and the application of the cost approach generally requires the
replacement cost of an asset to be adjusted for physical deterioration, and functional and economic obsolescence. We
estimated economic obsolescence as the difference between the discounted cash flows expected to be realized from our
utilization of the assets as a group, compared to the initial estimate of value from the cost approach method. We did not reduce
any fixed asset below its liquidation in place value as a result of economic obsolescence; however the effects of economic
obsolescence caused some of our fixed assets to be recorded at their liquidation in place values.
• The income approach which considers value in relation to the present worth of future benefits derived from ownership, usually
measured through the capitalization of a specific level of income which can be derived from the subject asset. This method
assumed fair value could not exceed the present value of the cash flows the assets generate discounted at a risk related rate of
return commensurate with the level of risk inherent in the subject asset. This method was used to value certain assets related to
buildings and improvements, leasehold interest, machinery and equipment and tooling.
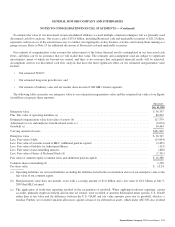
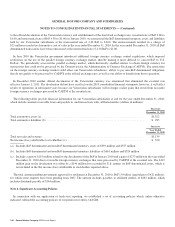
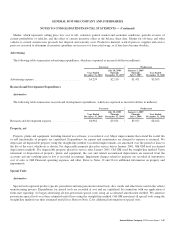
The following table summarizes the components of Property as a result of the application of fresh-start reporting at July 10, 2009
and Property, net at July 9, 2009:
Successor Predecessor
July 10,
2009
July 9,
2009
Land ..................................................................................... $ 2,524 $ 1,040
Buildings and land improvements, net .......................................................... 3,731 8,490
Machinery and equipment, net ................................................................ 5,915 13,597
Construction in progress ..................................................................... 1,838 2,307
Real estate, plants, and equipment, net .......................................................... 14,008 25,434
Special tools, net ........................................................................... 4,492 10,782
Total property, net .......................................................................... $18,500 $36,216
Goodwill
We recorded Goodwill of $30.5 billion upon application of fresh-start reporting. When applying fresh-start reporting, certain
accounts, primarily employee benefit and income tax related, were recorded at amounts determined under specific U.S. GAAP rather
than fair value and the difference between the U.S. GAAP and fair value amounts gives rise to goodwill, which is a residual. Further,
we recorded valuation allowances against certain of our deferred tax assets, which under ASC 852 also resulted in goodwill. Our
employee benefit related accounts were recorded in accordance with ASC 712 and ASC 715 and deferred income taxes were recorded
in accordance with ASC 740. None of the goodwill from this transaction is deductible for tax purposes.
Intangible Assets
We recorded Intangible assets of $16.1 billion at their fair values. The following is a summary of the approaches used to determine
the fair value of our significant intangible assets:
• We recorded $7.9 billion for the fair value of technology. The relief from royalty method was used to calculate the $7.7 billion
fair value of developed technology. The significant assumptions used included:
• Forecasted revenue for each technology category by Old GM’s former segments;
138 General Motors Company 2010 Annual Report