General Motors 2010 Annual Report Download - page 186
Download and view the complete annual report
Please find page 186 of the 2010 General Motors annual report below. You can navigate through the pages in the report by either clicking on the pages listed below, or by using the keyword search tool below to find specific information within the annual report.-
 1
1 -
2
-
3
-
4
-
5
-
6
-
7
-
8
-
9
-
10
-
11
-
12
-
13
-
14
-
15
-
16
-
17
-
18
-
19
-
20
-
21
-
22
-
23
-
24
-
25
-
26
-
27
-
28
-
29
-
30
-
31
-
32
-
33
-
34
-
35
-
36
-
37
-
38
-
39
-
40
-
41
-
42
-
43
-
44
-
45
-
46
-
47
-
48
-
49
-
50
-
51
-
52
-
53
-
54
-
55
-
56
-
57
-
58
-
59
-
60
-
61
-
62
-
63
-
64
-
65
-
66
-
67
-
68
-
69
-
70
-
71
-
72
-
73
-
74
-
75
-
76
-
77
-
78
-
79
-
80
-
81
-
82
-
83
-
84
-
85
-
86
-
87
-
88
-
89
-
90
-
91
-
92
-
93
-
94
-
95
-
96
-
97
-
98
-
99
-
100
-
101
-
102
-
103
-
104
-
105
-
106
-
107
-
108
-
109
-
110
-
111
-
112
-
113
-
114
-
115
-
116
-
117
-
118
-
119
-
120
-
121
-
122
-
123
-
124
-
125
-
126
-
127
-
128
-
129
-
130
-
131
-
132
-
133
-
134
-
135
-
136
-
137
-
138
-
139
-
140
-
141
-
142
-
143
-
144
-
145
-
146
-
147
-
148
-
149
-
150
-
151
-
152
-
153
-
154
-
155
-
156
-
157
-
158
-
159
-
160
-
161
-
162
-
163
-
164
-
165
-
166
-
167
-
168
-
169
-
170
-
171
-
172
-
173
-
174
-
175
-
 176
176 -
 177
177 -
 178
178 -
 179
179 -
 180
180 -
 181
181 -
 182
182 -
 183
183 -
 184
184 -
 185
185 -
 186
186 -
 187
187 -
 188
188 -
 189
189 -
 190
190 -
 191
191 -
 192
192 -
 193
193 -
 194
194 -
 195
195 -
 196
196 -
197
-
198
-
199
-
200
-
201
-
202
-
203
-
204
-
205
-
206
-
207
-
208
-
209
-
210
-
211
-
212
-
213
-
214
-
215
-
216
-
217
-
218
-
219
-
220
-
221
-
222
-
223
-
224
-
225
-
226
-
227
-
228
-
229
-
230
-
231
-
232
-
233
-
234
-
235
-
236
-
237
-
238
-
239
-
240
-
241
-
242
-
243
-
244
-
245
-
246
-
247
-
248
-
249
-
250
-
251
-
252
-
253
-
254
-
255
-
256
-
257
-
258
-
259
-
260
-
261
-
262
-
263
-
264
-
265
-
266
-
267
-
268
-
269
-
270
-
271
-
272
-
273
-
274
-
275
-
276
-
277
-
278
-
279
-
280
-
281
-
282
-
283
-
284
-
285
-
286
-
287
-
288
-
289
-
290
 |
 |

GENERAL MOTORS COMPANY AND SUBSIDIARIES
NOTES TO CONSOLIDATED FINANCIAL STATEMENTS — (Continued)
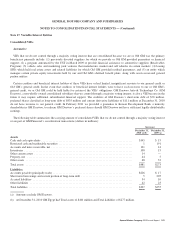
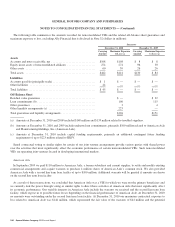
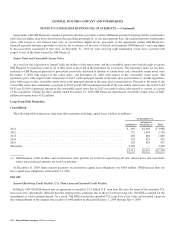
The following table summarizes the amounts recorded for nonconsolidated VIEs and the related off-balance sheet guarantees and
maximum exposure to loss, excluding Ally Financial that is disclosed in Note 32 (dollars in millions):
Successor
December 31, 2010 December 31, 2009
Carrying
Amount
Maximum Exposure
to Loss (a)
Carrying
Amount
Maximum Exposure
to Loss (a)
Assets
Accounts and notes receivable, net ............................... $108 $108 $ 8 $ 8
Equity in net assets of nonconsolidated affiliates .................... 274 274 96 50
Other assets ................................................. 60 59 26 26
Total assets ................................................. $442 $441 $130 $ 84
Liabilities
Accounts payable (principally trade) .............................. $ 1 $ — $ — $ —
Other liabilities .............................................. 44———
Total liabilities ............................................... $ 45 $ — $ — $ —
Off-Balance Sheet
Residual value guarantees ...................................... $ — $ 32
Loan commitments (b) ......................................... 100 115
Other guarantees ............................................. 3 4
Other liquidity arrangements (c) ................................. 223 —
Total guarantees and liquidity arrangements ........................ $326 $151
(a) Amounts at December 31, 2010 and 2009 included $148 million and $139 million related to troubled suppliers.
(b) Amounts at December 31, 2010 and 2009 include undrawn loan commitments, primarily $100 million related to American Axle
and Manufacturing Holdings, Inc. (American Axle).
(c) Amounts at December 31, 2010 include capital funding requirements, primarily an additional contingent future funding
requirement of up to $223 million related to HKJV.
Stated contractual voting or similar rights for certain of our joint venture arrangements provide various parties with shared power
over the activities that most significantly affect the economic performance of certain nonconsolidated VIEs. Such nonconsolidated
VIEs are operating joint ventures located in developing international markets.
American Axle
In September 2009 we paid $110 million to American Axle, a former subsidiary and current supplier, to settle and modify existing
commercial arrangements and acquire warrants to purchase 4 million shares of American Axle’s common stock. We also provided
American Axle with a second lien term loan facility of up to $100 million. Additional warrants will be granted if amounts are drawn
on the second lien term loan facility.
As a result of these transactions, we concluded that American Axle was a VIE for which we were not the primary beneficiary and
we currently lack the power through voting or similar rights to direct those activities of American Axle that most significantly affect
its economic performance. Our variable interests in American Axle include the warrants we received and the second lien term loan
facility, which expose us to possible future losses depending on the financial performance of American Axle. At December 31, 2010
no amounts were outstanding under the second lien term loan facility. At December 31, 2010 our maximum contractual exposure to
loss related to American Axle was $144 million, which represented the fair value of the warrants of $44 million and the potential
184 General Motors Company 2010 Annual Report