General Motors 2010 Annual Report Download - page 181
Download and view the complete annual report
Please find page 181 of the 2010 General Motors annual report below. You can navigate through the pages in the report by either clicking on the pages listed below, or by using the keyword search tool below to find specific information within the annual report.-
 1
1 -
2
-
3
-
4
-
5
-
6
-
7
-
8
-
9
-
10
-
11
-
12
-
13
-
14
-
15
-
16
-
17
-
18
-
19
-
20
-
21
-
22
-
23
-
24
-
25
-
26
-
27
-
28
-
29
-
30
-
31
-
32
-
33
-
34
-
35
-
36
-
37
-
38
-
39
-
40
-
41
-
42
-
43
-
44
-
45
-
46
-
47
-
48
-
49
-
50
-
51
-
52
-
53
-
54
-
55
-
56
-
57
-
58
-
59
-
60
-
61
-
62
-
63
-
64
-
65
-
66
-
67
-
68
-
69
-
70
-
71
-
72
-
73
-
74
-
75
-
76
-
77
-
78
-
79
-
80
-
81
-
82
-
83
-
84
-
85
-
86
-
87
-
88
-
89
-
90
-
91
-
92
-
93
-
94
-
95
-
96
-
97
-
98
-
99
-
100
-
101
-
102
-
103
-
104
-
105
-
106
-
107
-
108
-
109
-
110
-
111
-
112
-
113
-
114
-
115
-
116
-
117
-
118
-
119
-
120
-
121
-
122
-
123
-
124
-
125
-
126
-
127
-
128
-
129
-
130
-
131
-
132
-
133
-
134
-
135
-
136
-
137
-
138
-
139
-
140
-
141
-
142
-
143
-
144
-
145
-
146
-
147
-
148
-
149
-
150
-
151
-
152
-
153
-
154
-
155
-
156
-
157
-
158
-
159
-
160
-
161
-
162
-
163
-
164
-
165
-
166
-
167
-
168
-
169
-
170
-
 171
171 -
 172
172 -
 173
173 -
 174
174 -
 175
175 -
 176
176 -
 177
177 -
 178
178 -
 179
179 -
 180
180 -
 181
181 -
 182
182 -
 183
183 -
 184
184 -
 185
185 -
 186
186 -
 187
187 -
 188
188 -
 189
189 -
 190
190 -
 191
191 -
192
-
193
-
194
-
195
-
196
-
197
-
198
-
199
-
200
-
201
-
202
-
203
-
204
-
205
-
206
-
207
-
208
-
209
-
210
-
211
-
212
-
213
-
214
-
215
-
216
-
217
-
218
-
219
-
220
-
221
-
222
-
223
-
224
-
225
-
226
-
227
-
228
-
229
-
230
-
231
-
232
-
233
-
234
-
235
-
236
-
237
-
238
-
239
-
240
-
241
-
242
-
243
-
244
-
245
-
246
-
247
-
248
-
249
-
250
-
251
-
252
-
253
-
254
-
255
-
256
-
257
-
258
-
259
-
260
-
261
-
262
-
263
-
264
-
265
-
266
-
267
-
268
-
269
-
270
-
271
-
272
-
273
-
274
-
275
-
276
-
277
-
278
-
279
-
280
-
281
-
282
-
283
-
284
-
285
-
286
-
287
-
288
-
289
-
290
 |
 |

GENERAL MOTORS COMPANY AND SUBSIDIARIES
NOTES TO CONSOLIDATED FINANCIAL STATEMENTS — (Continued)
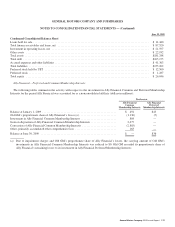
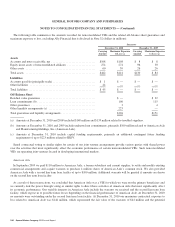
The following table summarizes the amortization expense related to intangible assets (dollars in millions):
Successor Predecessor
Year Ended
December 31,
2010
July 10, 2009
Through
December 31, 2009 (a)
January 1,
2009
Through
July 9, 2009
Year Ended
December 31,
2008
Amortization expense related to intangible assets .................. $2,560 $1,584 $44 $83
(a) Amortization expense in the period July 10, 2009 through December 31, 2009 includes an impairment charge of $21 million
related to technology and intellectual property. Refer to Note 26 for additional information on the impairment charge.
The following table summarizes estimated amortization expense related to intangible assets in each of the next five years (dollars in
millions):
Estimated
Amortization
Expense
2011 ............................................................................................ $1,785
2012 ............................................................................................ $1,560
2013 ............................................................................................ $1,227
2014 ............................................................................................ $ 611
2015 ............................................................................................ $ 314
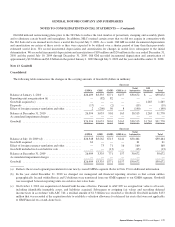
Note 15. Restricted Cash and Marketable Securities
Automotive
Cash and marketable securities subject to contractual restrictions and not readily available are classified as Restricted cash and
marketable securities. Restricted cash and marketable securities are invested in accordance with the terms of the underlying
agreements. Funds previously held in the UST Credit Agreement and currently held in the Canadian Health Care Trust (HCT) escrow
and other accounts have been invested in government securities and money market funds in accordance with the terms of the escrow
agreements. At December 31, 2010 and 2009 we held securities of $1.5 billion and $14.2 billion that were classified as Restricted cash
and marketable securities. Refer to Note 24 for additional information on securities classified as Restricted cash and marketable
securities.
The following table summarizes the components of automotive Restricted cash and marketable securities (dollars in millions):
Successor
December 31, 2010 December 31, 2009
Current
UST Credit Agreement (a) ........................................................ $ — $12,475
Canadian Health Care Trust (b) .................................................... 1,008 955
Receivables Program (c) .......................................................... — 187
Securitization trusts .............................................................. 6 191
Pre-funding disbursements ........................................................ 32 94
Other (d) ...................................................................... 194 15
Total current automotive Restricted cash and marketable securities ........................ 1,240 13,917
Non-current
Collateral for insurance related activities ............................................. 588 658
Other non-current (d) ............................................................ 572 831
Total automotive Restricted cash and marketable securities .............................. $2,400 $15,406
General Motors Company 2010 Annual Report 179