General Motors 2010 Annual Report Download - page 244
Download and view the complete annual report
Please find page 244 of the 2010 General Motors annual report below. You can navigate through the pages in the report by either clicking on the pages listed below, or by using the keyword search tool below to find specific information within the annual report.-
 1
1 -
2
-
3
-
4
-
5
-
6
-
7
-
8
-
9
-
10
-
11
-
12
-
13
-
14
-
15
-
16
-
17
-
18
-
19
-
20
-
21
-
22
-
23
-
24
-
25
-
26
-
27
-
28
-
29
-
30
-
31
-
32
-
33
-
34
-
35
-
36
-
37
-
38
-
39
-
40
-
41
-
42
-
43
-
44
-
45
-
46
-
47
-
48
-
49
-
50
-
51
-
52
-
53
-
54
-
55
-
56
-
57
-
58
-
59
-
60
-
61
-
62
-
63
-
64
-
65
-
66
-
67
-
68
-
69
-
70
-
71
-
72
-
73
-
74
-
75
-
76
-
77
-
78
-
79
-
80
-
81
-
82
-
83
-
84
-
85
-
86
-
87
-
88
-
89
-
90
-
91
-
92
-
93
-
94
-
95
-
96
-
97
-
98
-
99
-
100
-
101
-
102
-
103
-
104
-
105
-
106
-
107
-
108
-
109
-
110
-
111
-
112
-
113
-
114
-
115
-
116
-
117
-
118
-
119
-
120
-
121
-
122
-
123
-
124
-
125
-
126
-
127
-
128
-
129
-
130
-
131
-
132
-
133
-
134
-
135
-
136
-
137
-
138
-
139
-
140
-
141
-
142
-
143
-
144
-
145
-
146
-
147
-
148
-
149
-
150
-
151
-
152
-
153
-
154
-
155
-
156
-
157
-
158
-
159
-
160
-
161
-
162
-
163
-
164
-
165
-
166
-
167
-
168
-
169
-
170
-
171
-
172
-
173
-
174
-
175
-
176
-
177
-
178
-
179
-
180
-
181
-
182
-
183
-
184
-
185
-
186
-
187
-
188
-
189
-
190
-
191
-
192
-
193
-
194
-
195
-
196
-
197
-
198
-
199
-
200
-
201
-
202
-
203
-
204
-
205
-
206
-
207
-
208
-
209
-
210
-
211
-
212
-
213
-
214
-
215
-
216
-
217
-
218
-
219
-
220
-
221
-
222
-
223
-
224
-
225
-
226
-
227
-
228
-
229
-
230
-
231
-
232
-
233
-
 234
234 -
 235
235 -
 236
236 -
 237
237 -
 238
238 -
 239
239 -
 240
240 -
 241
241 -
 242
242 -
 243
243 -
 244
244 -
 245
245 -
 246
246 -
 247
247 -
 248
248 -
 249
249 -
 250
250 -
 251
251 -
 252
252 -
 253
253 -
 254
254 -
255
-
256
-
257
-
258
-
259
-
260
-
261
-
262
-
263
-
264
-
265
-
266
-
267
-
268
-
269
-
270
-
271
-
272
-
273
-
274
-
275
-
276
-
277
-
278
-
279
-
280
-
281
-
282
-
283
-
284
-
285
-
286
-
287
-
288
-
289
-
290
 |
 |

GENERAL MOTORS COMPANY AND SUBSIDIARIES
NOTES TO CONSOLIDATED FINANCIAL STATEMENTS — (Continued)
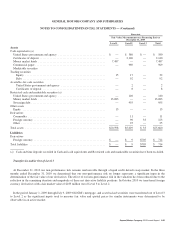
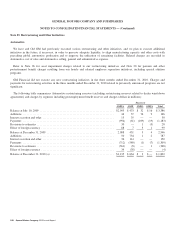
change, resulting in the reversal of some or all of the valuation allowances. If our operations generate taxable income prior to reaching
profitability on a sustained basis, we would reverse a portion of the valuation allowance related to the corresponding realized tax
benefit for that period, without changing our conclusions on the need for a full valuation allowance against the remaining net deferred
tax assets.
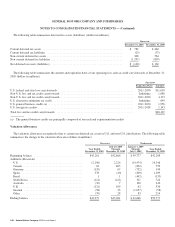
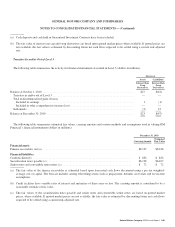
Uncertain Tax Positions
The following table summarizes gross unrecognized tax benefits before valuation allowances and the amount that would favorably
affect the effective tax rate in future periods after valuation allowances (dollars in millions):
Successor
December 31, 2010 December 31, 2009
Gross unrecognized tax benefits before valuation allowances ............................. $5,169 $5,410
Amount that would favorably affect effective tax rate in future ........................... $ 785 $ 618
Amount of liability for uncertain tax positions benefits netted against deferred tax assets in the
same jurisdiction (a) ........................................................... $3,605 $4,007
(a) The remaining uncertain tax positions are classified as current and non-current liabilities.
The following table summarizes activity of the total amounts of unrecognized tax benefits (dollars in millions):
Successor Predecessor
Year Ended
December 31, 2010
July 10, 2009
Through
December 31, 2009
January 1, 2009
Through
July 9, 2009
Year Ended
December 31, 2008
Beginning balance ................................... $5,410 $4,096 $2,803 $2,754
Additions to tax positions in the current year .............. 195 1,454 1,493 208
Additions to tax positions in prior years .................. 803 22 594 751
Reductions to tax positions in the current year ............. — (44) (25) (47)
Reductions to tax positions in prior years ................. (475) (128) (626) (725)
Reductions in tax positions due to lapse of statutory
limitations ....................................... (18) — (281) —
Settlements ........................................ (761) (111) (16) (275)
Other ............................................. 15 121 154 137
Ending balance ..................................... $5,169 $5,410 $4,096 $2,803
The following tables summarize information regarding income tax related interest and penalties (dollars in millions):
Successor Predecessor
Year Ended
December 31, 2010
July 10, 2009
Through
December 31, 2009
January 1, 2009
Through
July 9, 2009
Year Ended
December 31, 2008
Interest income ..................................... $13 $— $249 $26
Interest expense (benefit) ............................. $20 $30 $(31) $13
Penalties ........................................... $ 1 $— $ 30 $ 4
242 General Motors Company 2010 Annual Report