General Motors 2010 Annual Report Download - page 251
Download and view the complete annual report
Please find page 251 of the 2010 General Motors annual report below. You can navigate through the pages in the report by either clicking on the pages listed below, or by using the keyword search tool below to find specific information within the annual report.-
 1
1 -
2
-
3
-
4
-
5
-
6
-
7
-
8
-
9
-
10
-
11
-
12
-
13
-
14
-
15
-
16
-
17
-
18
-
19
-
20
-
21
-
22
-
23
-
24
-
25
-
26
-
27
-
28
-
29
-
30
-
31
-
32
-
33
-
34
-
35
-
36
-
37
-
38
-
39
-
40
-
41
-
42
-
43
-
44
-
45
-
46
-
47
-
48
-
49
-
50
-
51
-
52
-
53
-
54
-
55
-
56
-
57
-
58
-
59
-
60
-
61
-
62
-
63
-
64
-
65
-
66
-
67
-
68
-
69
-
70
-
71
-
72
-
73
-
74
-
75
-
76
-
77
-
78
-
79
-
80
-
81
-
82
-
83
-
84
-
85
-
86
-
87
-
88
-
89
-
90
-
91
-
92
-
93
-
94
-
95
-
96
-
97
-
98
-
99
-
100
-
101
-
102
-
103
-
104
-
105
-
106
-
107
-
108
-
109
-
110
-
111
-
112
-
113
-
114
-
115
-
116
-
117
-
118
-
119
-
120
-
121
-
122
-
123
-
124
-
125
-
126
-
127
-
128
-
129
-
130
-
131
-
132
-
133
-
134
-
135
-
136
-
137
-
138
-
139
-
140
-
141
-
142
-
143
-
144
-
145
-
146
-
147
-
148
-
149
-
150
-
151
-
152
-
153
-
154
-
155
-
156
-
157
-
158
-
159
-
160
-
161
-
162
-
163
-
164
-
165
-
166
-
167
-
168
-
169
-
170
-
171
-
172
-
173
-
174
-
175
-
176
-
177
-
178
-
179
-
180
-
181
-
182
-
183
-
184
-
185
-
186
-
187
-
188
-
189
-
190
-
191
-
192
-
193
-
194
-
195
-
196
-
197
-
198
-
199
-
200
-
201
-
202
-
203
-
204
-
205
-
206
-
207
-
208
-
209
-
210
-
211
-
212
-
213
-
214
-
215
-
216
-
217
-
218
-
219
-
220
-
221
-
222
-
223
-
224
-
225
-
226
-
227
-
228
-
229
-
230
-
231
-
232
-
233
-
234
-
235
-
236
-
237
-
238
-
239
-
240
-
 241
241 -
 242
242 -
 243
243 -
 244
244 -
 245
245 -
 246
246 -
 247
247 -
 248
248 -
 249
249 -
 250
250 -
 251
251 -
 252
252 -
 253
253 -
 254
254 -
 255
255 -
 256
256 -
 257
257 -
 258
258 -
 259
259 -
 260
260 -
 261
261 -
262
-
263
-
264
-
265
-
266
-
267
-
268
-
269
-
270
-
271
-
272
-
273
-
274
-
275
-
276
-
277
-
278
-
279
-
280
-
281
-
282
-
283
-
284
-
285
-
286
-
287
-
288
-
289
-
290
 |
 |

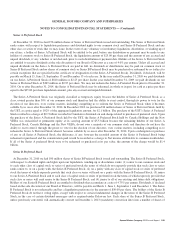
GENERAL MOTORS COMPANY AND SUBSIDIARIES
NOTES TO CONSOLIDATED FINANCIAL STATEMENTS — (Continued)
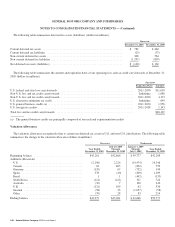
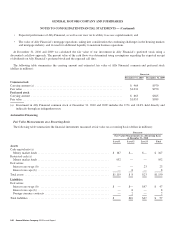
(a) Cash deposits and cash held in Guaranteed Investment Contracts have been excluded.
(b) The fair value of interest rate cap and swap derivatives are based upon quoted market prices when available. If quoted prices are
not available, the fair value is estimated by discounting future net cash flows expected to be settled using a current risk adjusted
rate.
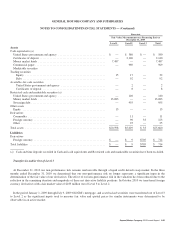
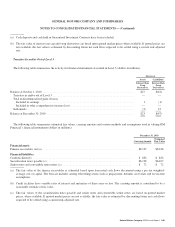
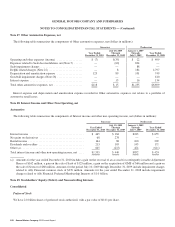
Transfers In and/or Out of Level 3
The following table summarizes the activity for financial instruments classified in Level 3 (dollars in millions):
Successor
Assets (Liabilities)
Interest Rate
Swap
Derivatives
Interest Rate
Swap
Derivatives
Balance at October 1, 2010 ................................................................ $27 $(61)
Transfers in and/or out of Level 3 ......................................................... — —
Total realized/unrealized gains (losses)
Included in earnings ................................................................. 1 (1)
Included in other comprehensive income (loss) ............................................ — —
Settlements .......................................................................... (5) 15
Balance at December 31, 2010 ............................................................. $23 $(47)
The following table summarizes estimated fair values, carrying amounts and various methods and assumptions used in valuing GM
Financial’s financial instruments (dollars in millions):
December 31, 2010
Carrying Amount
Estimated
Fair Value
Financial assets
Finance receivables, net (a) .............................................................. $8,197 $8,186
Financial liabilities
Credit facilities(b) ..................................................................... $ 832 $ 832
Securitization notes payable (c) ........................................................... $6,128 $6,107
Senior notes and convertible senior notes (c) ................................................ $ 72 $ 72
(a) The fair value of the finance receivables is estimated based upon forecasted cash flows discounted using a pre-tax weighted-
average cost of capital. The forecast includes among other things items such as prepayment, defaults, recoveries and fee income
assumptions.
(b) Credit facilities have variable rates of interest and maturities of three years or less. The carrying amount is considered to be a
reasonable estimate of fair value.
(c) The fair values of the securitization notes payable and senior notes and convertible senior notes are based on quoted market
prices, when available. If quoted market prices are not available, the fair value is estimated by discounting future net cash flows
expected to be settled using a current risk-adjusted rate.
General Motors Company 2010 Annual Report 249