General Motors 2010 Annual Report Download - page 72
Download and view the complete annual report
Please find page 72 of the 2010 General Motors annual report below. You can navigate through the pages in the report by either clicking on the pages listed below, or by using the keyword search tool below to find specific information within the annual report.-
 1
1 -
2
-
3
-
4
-
5
-
6
-
7
-
8
-
9
-
10
-
11
-
12
-
13
-
14
-
15
-
16
-
17
-
18
-
19
-
20
-
21
-
22
-
23
-
24
-
25
-
26
-
27
-
28
-
29
-
30
-
31
-
32
-
33
-
34
-
35
-
36
-
37
-
38
-
39
-
40
-
41
-
42
-
43
-
44
-
45
-
46
-
47
-
48
-
49
-
50
-
51
-
52
-
53
-
54
-
55
-
56
-
57
-
58
-
59
-
60
-
61
-
 62
62 -
 63
63 -
 64
64 -
 65
65 -
 66
66 -
 67
67 -
 68
68 -
 69
69 -
 70
70 -
 71
71 -
 72
72 -
 73
73 -
 74
74 -
 75
75 -
 76
76 -
 77
77 -
 78
78 -
 79
79 -
 80
80 -
 81
81 -
 82
82 -
83
-
84
-
85
-
86
-
87
-
88
-
89
-
90
-
91
-
92
-
93
-
94
-
95
-
96
-
97
-
98
-
99
-
100
-
101
-
102
-
103
-
104
-
105
-
106
-
107
-
108
-
109
-
110
-
111
-
112
-
113
-
114
-
115
-
116
-
117
-
118
-
119
-
120
-
121
-
122
-
123
-
124
-
125
-
126
-
127
-
128
-
129
-
130
-
131
-
132
-
133
-
134
-
135
-
136
-
137
-
138
-
139
-
140
-
141
-
142
-
143
-
144
-
145
-
146
-
147
-
148
-
149
-
150
-
151
-
152
-
153
-
154
-
155
-
156
-
157
-
158
-
159
-
160
-
161
-
162
-
163
-
164
-
165
-
166
-
167
-
168
-
169
-
170
-
171
-
172
-
173
-
174
-
175
-
176
-
177
-
178
-
179
-
180
-
181
-
182
-
183
-
184
-
185
-
186
-
187
-
188
-
189
-
190
-
191
-
192
-
193
-
194
-
195
-
196
-
197
-
198
-
199
-
200
-
201
-
202
-
203
-
204
-
205
-
206
-
207
-
208
-
209
-
210
-
211
-
212
-
213
-
214
-
215
-
216
-
217
-
218
-
219
-
220
-
221
-
222
-
223
-
224
-
225
-
226
-
227
-
228
-
229
-
230
-
231
-
232
-
233
-
234
-
235
-
236
-
237
-
238
-
239
-
240
-
241
-
242
-
243
-
244
-
245
-
246
-
247
-
248
-
249
-
250
-
251
-
252
-
253
-
254
-
255
-
256
-
257
-
258
-
259
-
260
-
261
-
262
-
263
-
264
-
265
-
266
-
267
-
268
-
269
-
270
-
271
-
272
-
273
-
274
-
275
-
276
-
277
-
278
-
279
-
280
-
281
-
282
-
283
-
284
-
285
-
286
-
287
-
288
-
289
-
290
 |
 |

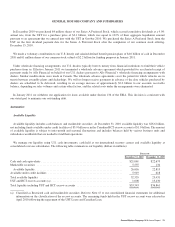
GENERAL MOTORS COMPANY AND SUBSIDIARIES
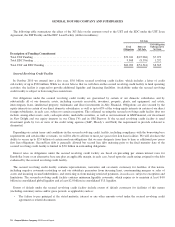
Income Before Income Taxes
In the three months ended December 31, 2010 results included: (1) Total revenue of $281 million; partially offset by (2) operating
and leased vehicle expenses of $73 million; (3) interest expense of $37 million; (4) provision for loan losses of $26 million; and
(5) acquisition expenses of $16 million. GM Financial’s operating expenses are primarily related to personnel costs that include base
salary and wages, performance incentives and benefits as well as related employment taxes. Provisions for loan losses are charged to
income to bring the allowance for loan losses to a level which management considers adequate to absorb probable credit losses
inherent in the portfolio of finance receivables originated since October 1, 2010. Interest expense represents interest paid on GM
Financial’s warehouse credit facilities, securitization notes payable, other unsecured debt and the amortization of the purchase
accounting premium.
Average debt outstanding in the three months ended December 31, 2010 was $7.3 billion and the effective rate of interest expensed
was 2.0%.
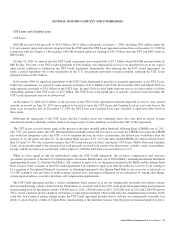
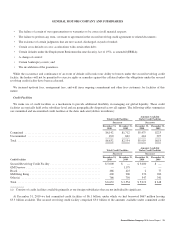
Corporate
(Dollars in Millions)
Successor Predecessor
Year Ended
December 31, 2010
July 10, 2009
Through
December 31, 2009
January 1, 2009
Through
July 9, 2009
Year Ended
December 31, 2008
Total net sales and revenue .......................... $134 $141 $ 327 $ 1,206
Net income (loss) attributable to stockholders .......... $(877) $176 $123,902 $(16,677)
Nonsegment operations are classified as Corporate. Corporate includes investments in Ally Financial, certain centrally recorded
income and costs, such as interest, income taxes and corporate expenditures, certain nonsegment specific revenues and expenses,
including costs related to the Delphi Benefit Guarantee Agreements and a portfolio of automotive retail leases.
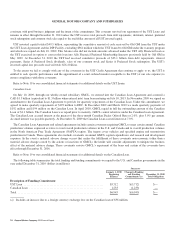
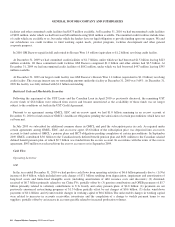
Corporate Total Net Sales and Revenue
(Dollars in Millions)
Successor
Combined GM
and Old GM Successor Predecessor
Year Ended
2010 vs. 2009
Change
Year Ended
2009 vs. 2008
Change
Year Ended
December 31,
2010
Year Ended
December 31,
2009
July 10, 2009
Through
December 31,
2009
January 1,
2009
Through
July 9, 2009
Year Ended
December 31,
2008 Amount % Amount %
Total net sales and revenue . . . $134 $468 $141 $327 $1,206 $(334) (71.4)% $(738) (61.2)%
Total net sales and revenue includes lease financing revenue from a portfolio of automotive retail leases.
In the year ended December 31, 2010 Total net sales and revenue decreased by $0.3 billion (or 71.4%) primarily due to decreased
lease financing revenue related to the liquidation of the portfolio of automotive leases. Average outstanding automotive retail leases
on-hand for GM and combined GM and Old GM were 7,000 and 73,000 for the years ended December 31, 2010 and 2009.
In the year ended December 31, 2009 Total net sales and revenue decreased by $0.7 billion (or 61.2%) primarily due to decreased
lease financing revenue of $0.7 billion related to the liquidation of the portfolio of automotive retail leases. Average outstanding
leases on-hand for combined GM and Old GM were 73,000 and 236,000 for the years ended December 31, 2009 and 2008.
70 General Motors Company 2010 Annual Report