General Motors 2010 Annual Report Download - page 280
Download and view the complete annual report
Please find page 280 of the 2010 General Motors annual report below. You can navigate through the pages in the report by either clicking on the pages listed below, or by using the keyword search tool below to find specific information within the annual report.-
 1
1 -
2
-
3
-
4
-
5
-
6
-
7
-
8
-
9
-
10
-
11
-
12
-
13
-
14
-
15
-
16
-
17
-
18
-
19
-
20
-
21
-
22
-
23
-
24
-
25
-
26
-
27
-
28
-
29
-
30
-
31
-
32
-
33
-
34
-
35
-
36
-
37
-
38
-
39
-
40
-
41
-
42
-
43
-
44
-
45
-
46
-
47
-
48
-
49
-
50
-
51
-
52
-
53
-
54
-
55
-
56
-
57
-
58
-
59
-
60
-
61
-
62
-
63
-
64
-
65
-
66
-
67
-
68
-
69
-
70
-
71
-
72
-
73
-
74
-
75
-
76
-
77
-
78
-
79
-
80
-
81
-
82
-
83
-
84
-
85
-
86
-
87
-
88
-
89
-
90
-
91
-
92
-
93
-
94
-
95
-
96
-
97
-
98
-
99
-
100
-
101
-
102
-
103
-
104
-
105
-
106
-
107
-
108
-
109
-
110
-
111
-
112
-
113
-
114
-
115
-
116
-
117
-
118
-
119
-
120
-
121
-
122
-
123
-
124
-
125
-
126
-
127
-
128
-
129
-
130
-
131
-
132
-
133
-
134
-
135
-
136
-
137
-
138
-
139
-
140
-
141
-
142
-
143
-
144
-
145
-
146
-
147
-
148
-
149
-
150
-
151
-
152
-
153
-
154
-
155
-
156
-
157
-
158
-
159
-
160
-
161
-
162
-
163
-
164
-
165
-
166
-
167
-
168
-
169
-
170
-
171
-
172
-
173
-
174
-
175
-
176
-
177
-
178
-
179
-
180
-
181
-
182
-
183
-
184
-
185
-
186
-
187
-
188
-
189
-
190
-
191
-
192
-
193
-
194
-
195
-
196
-
197
-
198
-
199
-
200
-
201
-
202
-
203
-
204
-
205
-
206
-
207
-
208
-
209
-
210
-
211
-
212
-
213
-
214
-
215
-
216
-
217
-
218
-
219
-
220
-
221
-
222
-
223
-
224
-
225
-
226
-
227
-
228
-
229
-
230
-
231
-
232
-
233
-
234
-
235
-
236
-
237
-
238
-
239
-
240
-
241
-
242
-
243
-
244
-
245
-
246
-
247
-
248
-
249
-
250
-
251
-
252
-
253
-
254
-
255
-
256
-
257
-
258
-
259
-
260
-
261
-
262
-
263
-
264
-
265
-
266
-
267
-
268
-
269
-
 270
270 -
 271
271 -
 272
272 -
 273
273 -
 274
274 -
 275
275 -
 276
276 -
 277
277 -
 278
278 -
 279
279 -
 280
280 -
 281
281 -
 282
282 -
 283
283 -
 284
284 -
 285
285 -
 286
286 -
 287
287 -
 288
288 -
 289
289 -
 290
290
 |
 |

GENERAL MOTORS COMPANY AND SUBSIDIARIES
NOTES TO CONSOLIDATED FINANCIAL STATEMENTS — (Continued)
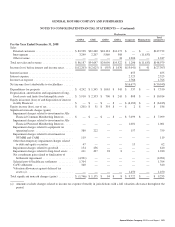
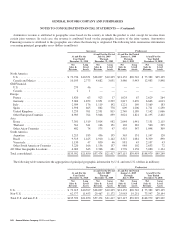
The following tables summarize key financial information by segment (dollars in millions):
Successor
GMNA GME GMIO GMSA Corporate Eliminations
Total
Automotive
GM
Financial (a) Eliminations Total
At and For the Year Ended
December 31, 2010
Sales
External customers ................. $79,514 $22,868 $17,730 $15,030 $ — $ — $135,142 $ — $ — $135,142
Financing operations ................
Revenue ..........................———— — — — 281 — 281
Intersegment ...................... 3,521 1,208 3,740 314 — (8,783) — — — —
Other revenue .....................———35 134 — 169 — — 169
Total net sales and revenue ............. $83,035 $24,076 $21,470 $15,379 $ 134 $ (8,783) $135,311 $ 281 $ — $135,592
Income (loss) before interest and income
taxes ............................ $ 5,748 $ (1,764) $ 2,262 $ 818 $ 389 $ (105) $ 7,348 $ 166 $ — $ 7,514
Corporate interest income .............. 465 — — 465
Interest expense ...................... 1,098 37 — 1,135
Income (loss) before income taxes ....... (244) 129 $ — 6,844
Income tax expense ................... 633 39 672
Net income (loss) attributable to
stockholders ....................... $ (877) $ 90 $ 6,172
Equity in net assets of nonconsolidated
affiliates .......................... $ 2,094 $ 8 $ 6,427 $ — $ — $ — $ 8,529 $ — $ — $ 8,529
Total assets ......................... $76,285 $18,375 $19,655 $12,964 $35,141 $(34,418) $128,002 $10,940 $(44) $138,898
Expenditures for property .............. $ 2,380 $ 634 $ 729 $ 411 $ 46 $ — $ 4,200 $ 2 $ — $ 4,202
Depreciation, amortization and impairment
of long-lived assets and finite-lived
intangible assets ................... $ 4,434 $ 1,476 $ 349 $ 496 $ 168 $ — $ 6,923 $ 7 $ — $ 6,930
Equity income (loss), net of tax ......... $ 120 $ 11 $ 1,307 $ (2) $ 2 $ — $ 1,438 $ — $ — $ 1,438
Significant noncash charges (gains)
Net contingent Adjustment Shares ..... $ — $ — $ — $ — $ (162) $ — $ (162) $ — $ — $ (162)
Gain on acquisition of GMS .......... — (66) — — — — (66) — — (66)
Reversal of valuation allowances against
deferred tax assets (b) .............———— (63) — (63) — — (63)
Impairment charges related to product-
specific tooling assets ............. 234 — 6 — — — 240 — — 240
Impairment charges related to equipment
on operating leases ............... — 49 — — — — 49 — — 49
Total significant noncash charges
(gains) ........................... $ 234 $ (17) $ 6 $ — $ (225) $ — $ (2) $ — $ — $ (2)
(a) The financial information presented for our GM Financial segment includes adjustments made to decrease Income tax expense and increase Net income (loss)
attributable to stockholders by $10 million and increase Total assets by $22 million to record the effect of changes in the valuation allowance on deferred tax assets
that were not applicable to GM Financial on a stand-alone basis.
(b) Amounts exclude changes related to income tax expense (benefit) in jurisdictions with a full valuation allowance throughout the period.
278 General Motors Company 2010 Annual Report