General Motors 2010 Annual Report Download - page 223
Download and view the complete annual report
Please find page 223 of the 2010 General Motors annual report below. You can navigate through the pages in the report by either clicking on the pages listed below, or by using the keyword search tool below to find specific information within the annual report.-
 1
1 -
2
-
3
-
4
-
5
-
6
-
7
-
8
-
9
-
10
-
11
-
12
-
13
-
14
-
15
-
16
-
17
-
18
-
19
-
20
-
21
-
22
-
23
-
24
-
25
-
26
-
27
-
28
-
29
-
30
-
31
-
32
-
33
-
34
-
35
-
36
-
37
-
38
-
39
-
40
-
41
-
42
-
43
-
44
-
45
-
46
-
47
-
48
-
49
-
50
-
51
-
52
-
53
-
54
-
55
-
56
-
57
-
58
-
59
-
60
-
61
-
62
-
63
-
64
-
65
-
66
-
67
-
68
-
69
-
70
-
71
-
72
-
73
-
74
-
75
-
76
-
77
-
78
-
79
-
80
-
81
-
82
-
83
-
84
-
85
-
86
-
87
-
88
-
89
-
90
-
91
-
92
-
93
-
94
-
95
-
96
-
97
-
98
-
99
-
100
-
101
-
102
-
103
-
104
-
105
-
106
-
107
-
108
-
109
-
110
-
111
-
112
-
113
-
114
-
115
-
116
-
117
-
118
-
119
-
120
-
121
-
122
-
123
-
124
-
125
-
126
-
127
-
128
-
129
-
130
-
131
-
132
-
133
-
134
-
135
-
136
-
137
-
138
-
139
-
140
-
141
-
142
-
143
-
144
-
145
-
146
-
147
-
148
-
149
-
150
-
151
-
152
-
153
-
154
-
155
-
156
-
157
-
158
-
159
-
160
-
161
-
162
-
163
-
164
-
165
-
166
-
167
-
168
-
169
-
170
-
171
-
172
-
173
-
174
-
175
-
176
-
177
-
178
-
179
-
180
-
181
-
182
-
183
-
184
-
185
-
186
-
187
-
188
-
189
-
190
-
191
-
192
-
193
-
194
-
195
-
196
-
197
-
198
-
199
-
200
-
201
-
202
-
203
-
204
-
205
-
206
-
207
-
208
-
209
-
210
-
211
-
212
-
 213
213 -
 214
214 -
 215
215 -
 216
216 -
 217
217 -
 218
218 -
 219
219 -
 220
220 -
 221
221 -
 222
222 -
 223
223 -
 224
224 -
 225
225 -
 226
226 -
 227
227 -
 228
228 -
 229
229 -
 230
230 -
 231
231 -
 232
232 -
 233
233 -
234
-
235
-
236
-
237
-
238
-
239
-
240
-
241
-
242
-
243
-
244
-
245
-
246
-
247
-
248
-
249
-
250
-
251
-
252
-
253
-
254
-
255
-
256
-
257
-
258
-
259
-
260
-
261
-
262
-
263
-
264
-
265
-
266
-
267
-
268
-
269
-
270
-
271
-
272
-
273
-
274
-
275
-
276
-
277
-
278
-
279
-
280
-
281
-
282
-
283
-
284
-
285
-
286
-
287
-
288
-
289
-
290
 |
 |

GENERAL MOTORS COMPANY AND SUBSIDIARIES
NOTES TO CONSOLIDATED FINANCIAL STATEMENTS — (Continued)
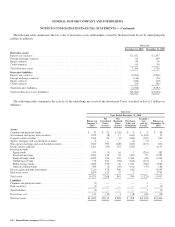
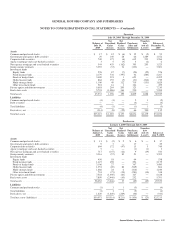
OPEB Contributions
The following table summarizes contributions (withdrawals) to the U.S. OPEB plans (dollars in millions):
Successor Predecessor
Year Ended
December 31, 2010
July 10, 2009
Through
December 31, 2009
January 1, 2009
Through
July 9, 2009
Year Ended
December 31,
2008 (a)
Employer contributions (withdrawals) ....................... $651 $1,528 $1,947 $(1,356)
Plan participants’ contributions. ............................ 53 172 169 401
Total contributions (withdrawals) .......................... $704 $1,700 $2,116 $ (955)
(a) Both the U.S. non-UAW hourly and salaried VEBAs were effectively liquidated by December 31, 2008 resulting in withdrawals
from plan assets.
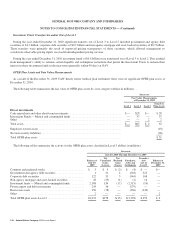
Benefit Payments
The following table summarizes net benefit payments expected to be paid in the future, which include assumptions related to
estimated future employee service, but does not reflect the effect of the 2009 CAW Agreement which provides for our independent
HCT (dollars in millions):
Successor
Years Ended December 31,
Pension Benefits (a) Other Benefits
U.S. Plans Non-U.S. Plans U.S. Plans (b) Non-U.S. Plans
2011 .......................................................... $ 8,765 $1,460 $ 451 $ 189
2012 .......................................................... $ 8,463 $1,461 $ 427 $ 199
2013 .......................................................... $ 8,186 $1,480 $ 407 $ 209
2014 .......................................................... $ 7,999 $1,513 $ 391 $ 220
2015 .......................................................... $ 7,855 $1,534 $ 379 $ 231
2016-2020 ...................................................... $36,033 $7,889 $1,796 $1,287
(a) Benefits for most U.S. pension plans and certain non-U.S. pension plans are paid out of plan assets rather than our cash and cash
equivalents.
(b) Benefit payments presented in this table reflect the effect of the implementation of the 2009 UAW Retiree Settlement Agreement
which releases us from UAW retiree healthcare claims incurred after December 31, 2009.
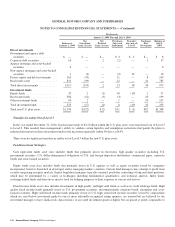
Note 21. Derivative Financial Instruments and Risk Management
Automotive
Derivatives and Hedge Accounting
We are party to a variety of foreign currency exchange rate and commodity derivative contracts entered into in connection with the
management of exposure to fluctuations in foreign currency exchange rates and certain commodity prices.
Our derivative instruments consist of derivative contracts or economic hedges, including forward contracts and options that we
acquired from Old GM or purchased directly from counterparties. At December 31, 2010 and 2009 no outstanding derivative contracts
were designated in hedging relationships other than those derivative contracts designated in a hedging relationship by GM Financial.
General Motors Company 2010 Annual Report 221