General Motors 2010 Annual Report Download - page 63
Download and view the complete annual report
Please find page 63 of the 2010 General Motors annual report below. You can navigate through the pages in the report by either clicking on the pages listed below, or by using the keyword search tool below to find specific information within the annual report.-
 1
1 -
2
-
3
-
4
-
5
-
6
-
7
-
8
-
9
-
10
-
11
-
12
-
13
-
14
-
15
-
16
-
17
-
18
-
19
-
20
-
21
-
22
-
23
-
24
-
25
-
26
-
27
-
28
-
29
-
30
-
31
-
32
-
33
-
34
-
35
-
36
-
37
-
38
-
39
-
40
-
41
-
42
-
43
-
44
-
45
-
46
-
47
-
48
-
49
-
50
-
51
-
52
-
 53
53 -
 54
54 -
 55
55 -
 56
56 -
 57
57 -
 58
58 -
 59
59 -
 60
60 -
 61
61 -
 62
62 -
 63
63 -
 64
64 -
 65
65 -
 66
66 -
 67
67 -
 68
68 -
 69
69 -
 70
70 -
 71
71 -
 72
72 -
 73
73 -
74
-
75
-
76
-
77
-
78
-
79
-
80
-
81
-
82
-
83
-
84
-
85
-
86
-
87
-
88
-
89
-
90
-
91
-
92
-
93
-
94
-
95
-
96
-
97
-
98
-
99
-
100
-
101
-
102
-
103
-
104
-
105
-
106
-
107
-
108
-
109
-
110
-
111
-
112
-
113
-
114
-
115
-
116
-
117
-
118
-
119
-
120
-
121
-
122
-
123
-
124
-
125
-
126
-
127
-
128
-
129
-
130
-
131
-
132
-
133
-
134
-
135
-
136
-
137
-
138
-
139
-
140
-
141
-
142
-
143
-
144
-
145
-
146
-
147
-
148
-
149
-
150
-
151
-
152
-
153
-
154
-
155
-
156
-
157
-
158
-
159
-
160
-
161
-
162
-
163
-
164
-
165
-
166
-
167
-
168
-
169
-
170
-
171
-
172
-
173
-
174
-
175
-
176
-
177
-
178
-
179
-
180
-
181
-
182
-
183
-
184
-
185
-
186
-
187
-
188
-
189
-
190
-
191
-
192
-
193
-
194
-
195
-
196
-
197
-
198
-
199
-
200
-
201
-
202
-
203
-
204
-
205
-
206
-
207
-
208
-
209
-
210
-
211
-
212
-
213
-
214
-
215
-
216
-
217
-
218
-
219
-
220
-
221
-
222
-
223
-
224
-
225
-
226
-
227
-
228
-
229
-
230
-
231
-
232
-
233
-
234
-
235
-
236
-
237
-
238
-
239
-
240
-
241
-
242
-
243
-
244
-
245
-
246
-
247
-
248
-
249
-
250
-
251
-
252
-
253
-
254
-
255
-
256
-
257
-
258
-
259
-
260
-
261
-
262
-
263
-
264
-
265
-
266
-
267
-
268
-
269
-
270
-
271
-
272
-
273
-
274
-
275
-
276
-
277
-
278
-
279
-
280
-
281
-
282
-
283
-
284
-
285
-
286
-
287
-
288
-
289
-
290
 |
 |

GENERAL MOTORS COMPANY AND SUBSIDIARIES
In the period July 10, 2009 through December 31, 2009 EBIT was a loss of $4.8 billion and included: (1) settlement loss of $2.6
billion related to the termination of our UAW hourly retiree medical plan and Mitigation Plan; (2) foreign currency remeasurement
losses of $1.3 billion driven by the general strengthening of the Canadian Dollar versus the U.S. Dollar; (3) charges of $0.3 billion
related to dealer wind-down costs for our Saturn dealers after plans to sell the Saturn brand and dealerships network were terminated;
partially offset by (4) favorable adjustments in Automotive cost of sales of $0.7 billion due to the sell through of inventory acquired
from Old GM at July 10, 2009. As required under U.S. GAAP, the acquired inventory was recorded at fair value as of the acquisition
date using a market participant approach, which for work in process and finished goods inventory considered the estimated selling
price of the inventory less the costs a market participant would incur to complete, sell and dispose of the inventory, which may be
different than our costs, and the profit margin required for its completion and disposal effort.
Old GM
In the period January 1, 2009 through July 9, 2009 EBIT was a loss of $11.1 billion and included: (1) incremental depreciation
charges of $2.1 billion recorded by Old GM prior to the 363 Sale for facilities included in GMNA’s restructuring activities and for
certain facilities that MLC retained; (2) curtailment loss of $1.7 billion upon the interim remeasurement of the U.S. hourly and U.S.
salaried defined benefit pension plans as a result of the 2009 Special Attrition Programs and salaried workforce reductions; (3) U.S.
hourly and salary separation program charges and Canadian restructuring activities of $1.1 billion; (4) foreign currency
remeasurement losses of $0.7 billion driven by the general strengthening of the Canadian Dollar against the U.S. Dollar; (5) charges
of $0.5 billion incurred for dealer wind-down costs; (6) derivative losses of $0.5 billion related to commodity and foreign currency
exchange derivatives; (7) a charge of $1.1 billion related to the SUB and TSP, partially offset by a favorable adjustment of $0.7
billion primarily related to the suspension of the JOBS Program; (8) charges of $0.4 billion primarily for impairments for special-
tooling and product related machinery and equipment; (9) charges of $0.3 billion related to obligations associated with various Delphi
agreements; and (10) equity losses of $0.3 billion related to impairment charges at NUMMI and our proportionate share of losses at
CAMI. MLC retained the investment in NUMMI, and CAMI has been consolidated since March 1, 2009.
In the year ended December 31, 2008 EBIT was a loss of $12.2 billion and included: (1) charges of $6.0 billion related to
restructuring and other costs associated with Old GM’s special attrition programs; (2) advertising and sales promotion expenses of
$4.0 billion primarily to support media campaigns for our products; (3) administrative expenses of $2.8 billion; (4) expenses of $1.7
billion related to the salaried post-65 healthcare settlement; (5) selling and marketing expenses of $0.9 billion related to our
dealerships; (6) losses of $0.8 billion related to commodity and foreign currency exchange derivatives; (7) impairment charges related
to product-specific tooling assets of $0.4 billion; and (8) charges of $0.3 billion associated with the finalization of Old GM’s
negotiations with the CAW partially offset by (9) net curtailment gain of $4.9 billion related to the 2008 UAW Settlement Agreement;
and (10) foreign currency remeasurement gains of $2.1 billion driven by the weakening of the Canadian Dollar against the U.S.
Dollar.
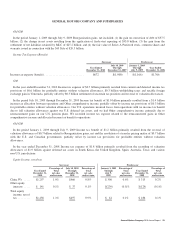
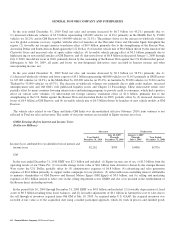
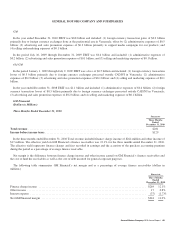
GM Europe
(Dollars in Millions)
Successor Predecessor
Year Ended
December 31, 2010
July 10, 2009
Through
December 31, 2009
January 1, 2009
Through
July 9, 2009
Year Ended
December 31, 2008
Total net sales and revenue .......................... $24,076 $11,479 $12,552 $34,647
Loss attributable to stockholders before interest and
income taxes .................................... $(1,764) $ (814) $ (2,815) $ (2,625)
General Motors Company 2010 Annual Report 61