General Motors 2010 Annual Report Download - page 241
Download and view the complete annual report
Please find page 241 of the 2010 General Motors annual report below. You can navigate through the pages in the report by either clicking on the pages listed below, or by using the keyword search tool below to find specific information within the annual report.-
 1
1 -
2
-
3
-
4
-
5
-
6
-
7
-
8
-
9
-
10
-
11
-
12
-
13
-
14
-
15
-
16
-
17
-
18
-
19
-
20
-
21
-
22
-
23
-
24
-
25
-
26
-
27
-
28
-
29
-
30
-
31
-
32
-
33
-
34
-
35
-
36
-
37
-
38
-
39
-
40
-
41
-
42
-
43
-
44
-
45
-
46
-
47
-
48
-
49
-
50
-
51
-
52
-
53
-
54
-
55
-
56
-
57
-
58
-
59
-
60
-
61
-
62
-
63
-
64
-
65
-
66
-
67
-
68
-
69
-
70
-
71
-
72
-
73
-
74
-
75
-
76
-
77
-
78
-
79
-
80
-
81
-
82
-
83
-
84
-
85
-
86
-
87
-
88
-
89
-
90
-
91
-
92
-
93
-
94
-
95
-
96
-
97
-
98
-
99
-
100
-
101
-
102
-
103
-
104
-
105
-
106
-
107
-
108
-
109
-
110
-
111
-
112
-
113
-
114
-
115
-
116
-
117
-
118
-
119
-
120
-
121
-
122
-
123
-
124
-
125
-
126
-
127
-
128
-
129
-
130
-
131
-
132
-
133
-
134
-
135
-
136
-
137
-
138
-
139
-
140
-
141
-
142
-
143
-
144
-
145
-
146
-
147
-
148
-
149
-
150
-
151
-
152
-
153
-
154
-
155
-
156
-
157
-
158
-
159
-
160
-
161
-
162
-
163
-
164
-
165
-
166
-
167
-
168
-
169
-
170
-
171
-
172
-
173
-
174
-
175
-
176
-
177
-
178
-
179
-
180
-
181
-
182
-
183
-
184
-
185
-
186
-
187
-
188
-
189
-
190
-
191
-
192
-
193
-
194
-
195
-
196
-
197
-
198
-
199
-
200
-
201
-
202
-
203
-
204
-
205
-
206
-
207
-
208
-
209
-
210
-
211
-
212
-
213
-
214
-
215
-
216
-
217
-
218
-
219
-
220
-
221
-
222
-
223
-
224
-
225
-
226
-
227
-
228
-
229
-
230
-
 231
231 -
 232
232 -
 233
233 -
 234
234 -
 235
235 -
 236
236 -
 237
237 -
 238
238 -
 239
239 -
 240
240 -
 241
241 -
 242
242 -
 243
243 -
 244
244 -
 245
245 -
 246
246 -
 247
247 -
 248
248 -
 249
249 -
 250
250 -
 251
251 -
252
-
253
-
254
-
255
-
256
-
257
-
258
-
259
-
260
-
261
-
262
-
263
-
264
-
265
-
266
-
267
-
268
-
269
-
270
-
271
-
272
-
273
-
274
-
275
-
276
-
277
-
278
-
279
-
280
-
281
-
282
-
283
-
284
-
285
-
286
-
287
-
288
-
289
-
290
 |
 |

GENERAL MOTORS COMPANY AND SUBSIDIARIES
NOTES TO CONSOLIDATED FINANCIAL STATEMENTS — (Continued)
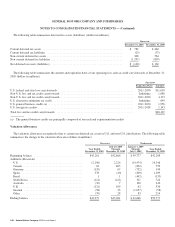
The following table summarizes a reconciliation of the provision (benefit) for income taxes compared with the amounts at the U.S.
federal statutory rate (dollars in millions):
Successor Predecessor
Year Ended
December 31, 2010
July 10, 2009
Through
December 31, 2009
January 1, 2009
Through
July 9, 2009
Year Ended
December 31,
2008
Tax at U.S. federal statutory income tax rate .................. $2,008 $(1,849) $ 37,721 $(10,315)
State and local tax expense ................................ 334 (559) (260) (1,151)
Foreign income taxed at other than 35% ..................... 1,579 64 (119) 1,229
Taxes on unremitted earnings of subsidiaries .................. (10) (151) (12) (235)
Change in valuation allowance ............................. (2,903) 1,338 6,609 13,064
Change in statutory tax rates .............................. — 163 1 151
Research and development incentives ....................... (235) (14) (113) (367)
Medicare prescription drug benefit .......................... — — 18 (104)
Settlements of prior year tax matters ........................ (170) — — —
VEBA contribution ...................................... — (328) — —
Non-taxable reorganization gain ........................... — — (45,564) —
Foreign currency remeasurement ........................... 143 340 207 (608)
Other adjustments ....................................... (74) (4) 346 102
Total income tax expense (benefit) ......................... $ 672 $(1,000) $ (1,166) $ 1,766
Deferred Income Tax Assets and Liabilities
Deferred income tax assets and liabilities at December 31, 2010 and 2009 reflect the effect of temporary differences between
amounts of assets, liabilities and equity for financial reporting purposes and the bases of such assets, liabilities and equity as measured
by tax laws, as well as tax loss and tax credit carryforwards.
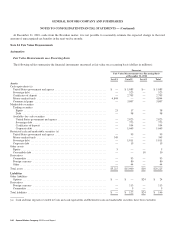
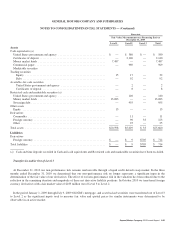
The following table summarizes the components of temporary differences and carryforwards that give rise to deferred tax assets
(liabilities) (dollars in millions):
Successor
December 31, 2010 December 31, 2009
Deferred tax assets
Postretirement benefits other than pensions ........................................... $ 3,884 $ 5,231
Pension and other employee benefit plans ............................................ 7,127 8,951
Warranties, dealer and customer allowances, claims and discounts ......................... 4,276 4,255
Property, plants and equipment ..................................................... 2,275 3,333
Capitalized research expenditures ................................................... 5,033 4,693
Tax carryforwards ............................................................... 20,109 18,880
Miscellaneous U.S. .............................................................. 2,387 2,693
Miscellaneous non-U.S. .......................................................... 357 1,049
Total deferred tax assets before valuation allowances ................................. 45,448 49,085
Less: Valuation allowances ........................................................ (42,979) (45,281)
Net deferred tax assets ........................................................... 2,469 3,804
Deferred tax liabilities
Intangible assets ................................................................ 2,609 3,642
Total deferred tax liabilities ..................................................... 2,609 3,642
Net deferred tax assets (liabilities) .................................................. $ (140) $ 162
General Motors Company 2010 Annual Report 239