General Motors 2010 Annual Report Download - page 199
Download and view the complete annual report
Please find page 199 of the 2010 General Motors annual report below. You can navigate through the pages in the report by either clicking on the pages listed below, or by using the keyword search tool below to find specific information within the annual report.-
 1
1 -
2
-
3
-
4
-
5
-
6
-
7
-
8
-
9
-
10
-
11
-
12
-
13
-
14
-
15
-
16
-
17
-
18
-
19
-
20
-
21
-
22
-
23
-
24
-
25
-
26
-
27
-
28
-
29
-
30
-
31
-
32
-
33
-
34
-
35
-
36
-
37
-
38
-
39
-
40
-
41
-
42
-
43
-
44
-
45
-
46
-
47
-
48
-
49
-
50
-
51
-
52
-
53
-
54
-
55
-
56
-
57
-
58
-
59
-
60
-
61
-
62
-
63
-
64
-
65
-
66
-
67
-
68
-
69
-
70
-
71
-
72
-
73
-
74
-
75
-
76
-
77
-
78
-
79
-
80
-
81
-
82
-
83
-
84
-
85
-
86
-
87
-
88
-
89
-
90
-
91
-
92
-
93
-
94
-
95
-
96
-
97
-
98
-
99
-
100
-
101
-
102
-
103
-
104
-
105
-
106
-
107
-
108
-
109
-
110
-
111
-
112
-
113
-
114
-
115
-
116
-
117
-
118
-
119
-
120
-
121
-
122
-
123
-
124
-
125
-
126
-
127
-
128
-
129
-
130
-
131
-
132
-
133
-
134
-
135
-
136
-
137
-
138
-
139
-
140
-
141
-
142
-
143
-
144
-
145
-
146
-
147
-
148
-
149
-
150
-
151
-
152
-
153
-
154
-
155
-
156
-
157
-
158
-
159
-
160
-
161
-
162
-
163
-
164
-
165
-
166
-
167
-
168
-
169
-
170
-
171
-
172
-
173
-
174
-
175
-
176
-
177
-
178
-
179
-
180
-
181
-
182
-
183
-
184
-
185
-
186
-
187
-
188
-
 189
189 -
 190
190 -
 191
191 -
 192
192 -
 193
193 -
 194
194 -
 195
195 -
 196
196 -
 197
197 -
 198
198 -
 199
199 -
 200
200 -
 201
201 -
 202
202 -
 203
203 -
 204
204 -
 205
205 -
 206
206 -
 207
207 -
 208
208 -
 209
209 -
210
-
211
-
212
-
213
-
214
-
215
-
216
-
217
-
218
-
219
-
220
-
221
-
222
-
223
-
224
-
225
-
226
-
227
-
228
-
229
-
230
-
231
-
232
-
233
-
234
-
235
-
236
-
237
-
238
-
239
-
240
-
241
-
242
-
243
-
244
-
245
-
246
-
247
-
248
-
249
-
250
-
251
-
252
-
253
-
254
-
255
-
256
-
257
-
258
-
259
-
260
-
261
-
262
-
263
-
264
-
265
-
266
-
267
-
268
-
269
-
270
-
271
-
272
-
273
-
274
-
275
-
276
-
277
-
278
-
279
-
280
-
281
-
282
-
283
-
284
-
285
-
286
-
287
-
288
-
289
-
290
 |
 |

GENERAL MOTORS COMPANY AND SUBSIDIARIES
NOTES TO CONSOLIDATED FINANCIAL STATEMENTS — (Continued)
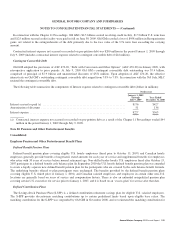
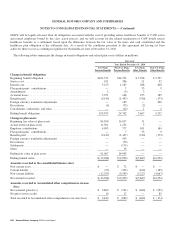
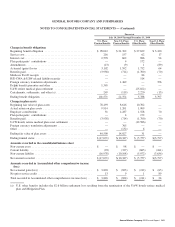
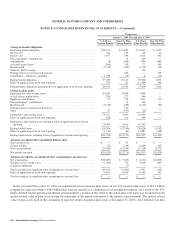
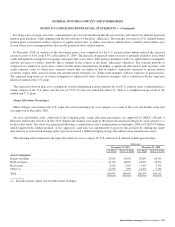
The following tables summarize the significant defined benefit plan interim remeasurements, the related changes in accumulated
postretirement benefit obligations (APBO), projected benefit obligations (PBO) and the associated curtailments, settlements and
termination benefits recorded in our earnings in the period July 10, 2009 through December 31, 2009 and the period January 1, 2009
through July 9, 2009, which are subsequently discussed (dollars in millions):
Successor
July 10, 2009 Through December 31, 2009
Event and Remeasurement
Date When Applicable Affected Plans
Change in
Discount Rate
Increase
(Decrease)
Since the Most
Recent
Remeasurement
Date (a) Gain (Loss)
From To PBO/APBO Curtailments Settlements
Termination
Benefits and
Other
2009 Special Attrition
Programs (b)
U.S. hourly defined benefit
pension plan — — $ 58 $— $ — $ (58)
Global salaried workforce
reductions (b)
U.S. salaried defined
benefit pension plan — — 175 — — (175)
2009 UAW Retiree
Settlement Agreement —
December
UAW hourly retiree
medical plan
— — (22,654) — (2,571) —
IUE-CWA and USW
Settlement Agreement —
November (c)
U.S. hourly defined benefit
pension plan
5.58% 5.26% 1,897 — — —
Non-UAW hourly retiree
healthcare plan 6.21% 5.00% 360 — — —
U.S. hourly life plan 5.41% 5.56% 53 — — —
Delphi Benefit Guarantee
Agreements — August (c)
U.S. hourly defined benefit
pension plan 5.83% 5.58% 2,548 — — —
Total $(17,563) $— $(2,571) $(233)
(a) The increase (decrease) includes effect of the event, gain or loss from remeasurement, net periodic benefit cost and benefit
payments. Excludes effect of asset returns that are higher or lower than expected.
(b) Reflects the effect on PBO. There was no remeasurement.
(c) Includes reclassification of contingent liability to benefit plan obligation.
General Motors Company 2010 Annual Report 197