General Motors 2010 Annual Report Download - page 260
Download and view the complete annual report
Please find page 260 of the 2010 General Motors annual report below. You can navigate through the pages in the report by either clicking on the pages listed below, or by using the keyword search tool below to find specific information within the annual report.-
 1
1 -
2
-
3
-
4
-
5
-
6
-
7
-
8
-
9
-
10
-
11
-
12
-
13
-
14
-
15
-
16
-
17
-
18
-
19
-
20
-
21
-
22
-
23
-
24
-
25
-
26
-
27
-
28
-
29
-
30
-
31
-
32
-
33
-
34
-
35
-
36
-
37
-
38
-
39
-
40
-
41
-
42
-
43
-
44
-
45
-
46
-
47
-
48
-
49
-
50
-
51
-
52
-
53
-
54
-
55
-
56
-
57
-
58
-
59
-
60
-
61
-
62
-
63
-
64
-
65
-
66
-
67
-
68
-
69
-
70
-
71
-
72
-
73
-
74
-
75
-
76
-
77
-
78
-
79
-
80
-
81
-
82
-
83
-
84
-
85
-
86
-
87
-
88
-
89
-
90
-
91
-
92
-
93
-
94
-
95
-
96
-
97
-
98
-
99
-
100
-
101
-
102
-
103
-
104
-
105
-
106
-
107
-
108
-
109
-
110
-
111
-
112
-
113
-
114
-
115
-
116
-
117
-
118
-
119
-
120
-
121
-
122
-
123
-
124
-
125
-
126
-
127
-
128
-
129
-
130
-
131
-
132
-
133
-
134
-
135
-
136
-
137
-
138
-
139
-
140
-
141
-
142
-
143
-
144
-
145
-
146
-
147
-
148
-
149
-
150
-
151
-
152
-
153
-
154
-
155
-
156
-
157
-
158
-
159
-
160
-
161
-
162
-
163
-
164
-
165
-
166
-
167
-
168
-
169
-
170
-
171
-
172
-
173
-
174
-
175
-
176
-
177
-
178
-
179
-
180
-
181
-
182
-
183
-
184
-
185
-
186
-
187
-
188
-
189
-
190
-
191
-
192
-
193
-
194
-
195
-
196
-
197
-
198
-
199
-
200
-
201
-
202
-
203
-
204
-
205
-
206
-
207
-
208
-
209
-
210
-
211
-
212
-
213
-
214
-
215
-
216
-
217
-
218
-
219
-
220
-
221
-
222
-
223
-
224
-
225
-
226
-
227
-
228
-
229
-
230
-
231
-
232
-
233
-
234
-
235
-
236
-
237
-
238
-
239
-
240
-
241
-
242
-
243
-
244
-
245
-
246
-
247
-
248
-
249
-
 250
250 -
 251
251 -
 252
252 -
 253
253 -
 254
254 -
 255
255 -
 256
256 -
 257
257 -
 258
258 -
 259
259 -
 260
260 -
 261
261 -
 262
262 -
 263
263 -
 264
264 -
 265
265 -
 266
266 -
 267
267 -
 268
268 -
 269
269 -
 270
270 -
271
-
272
-
273
-
274
-
275
-
276
-
277
-
278
-
279
-
280
-
281
-
282
-
283
-
284
-
285
-
286
-
287
-
288
-
289
-
290
 |
 |

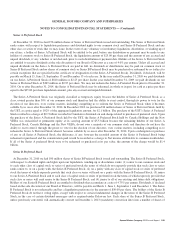
GENERAL MOTORS COMPANY AND SUBSIDIARIES
NOTES TO CONSOLIDATED FINANCIAL STATEMENTS — (Continued)
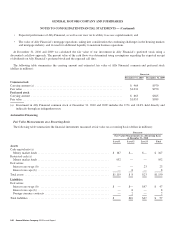
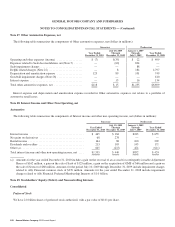
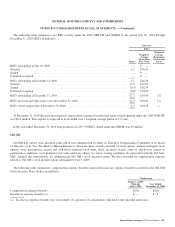
Note 27. Other Automotive Expenses, net
The following table summarizes the components of Other automotive expenses, net (dollars in millions):
Successor Predecessor
Year Ended
December 31, 2010
July 10, 2009
Through
December 31, 2009
January 1, 2009
Through
July 9, 2009
Year Ended
December 31, 2008
Operating and other expenses (income) .................. $ (7) $(35) $ 22 $ 409
Expenses related to Saab deconsolidation, net (Note 5) ...... — (60) 824 —
Saab impairment charges .............................. — — 88 —
Delphi related charges (Note 22) ........................ — 8 184 4,797
Depreciation and amortization expense .................. 125 89 101 749
Goodwill impairment charges (Note 26) .................. — — — 610
Interest expense ..................................... — 13 16 134
Total other automotive expenses, net .................... $118 $ 15 $1,235 $6,699
Interest expense and depreciation and amortization expense recorded in Other automotive expenses, net relates to a portfolio of
automotive retail leases.
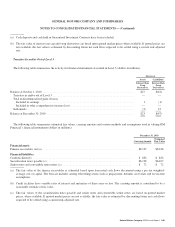
Note 28. Interest Income and Other Non-Operating, net
Automotive
The following table summarizes the components of Interest income and other non-operating income, net (dollars in millions):
Successor Predecessor
Year Ended
December 31, 2010
July 10, 2009
Through
December 31, 2009
January 1, 2009
Through
July 9, 2009
Year Ended
December 31, 2008
Interest income ...................................... $ 465 $184 $183 $ 655
Net gains on derivatives ............................... 68 278 — —
Rental income ....................................... 164 88 100 209
Dividends and royalties ................................ 213 105 145 171
Other (a) ............................................ 645 (215) 424 (611)
Total interest income and other non-operating income, net .... $1,555 $ 440 $852 $ 424
(a) Amounts for the year ended December 31, 2010 include a gain on the reversal of an accrual for contingently issuable Adjustment
Shares of $162 million, a gain on the sale of Saab of $123 million, a gain on the acquisition of GMS of $66 million and a gain on
the sale of Nexteer of $60 million. Amounts for the period July 10, 2009 through December 31, 2009 include impairment charges
related to Ally Financial common stock of $270 million. Amounts for the year ended December 31, 2008 include impairment
charges related to Ally Financial Preferred Membership Interests of $1.0 billion.
Note 29. Stockholders’ Equity (Deficit) and Noncontrolling Interests
Consolidated
Preferred Stock
We have 2.0 billion shares of preferred stock authorized, with a par value of $0.01 per share.
258 General Motors Company 2010 Annual Report