General Motors 2010 Annual Report Download - page 143
Download and view the complete annual report
Please find page 143 of the 2010 General Motors annual report below. You can navigate through the pages in the report by either clicking on the pages listed below, or by using the keyword search tool below to find specific information within the annual report.-
 1
1 -
2
-
3
-
4
-
5
-
6
-
7
-
8
-
9
-
10
-
11
-
12
-
13
-
14
-
15
-
16
-
17
-
18
-
19
-
20
-
21
-
22
-
23
-
24
-
25
-
26
-
27
-
28
-
29
-
30
-
31
-
32
-
33
-
34
-
35
-
36
-
37
-
38
-
39
-
40
-
41
-
42
-
43
-
44
-
45
-
46
-
47
-
48
-
49
-
50
-
51
-
52
-
53
-
54
-
55
-
56
-
57
-
58
-
59
-
60
-
61
-
62
-
63
-
64
-
65
-
66
-
67
-
68
-
69
-
70
-
71
-
72
-
73
-
74
-
75
-
76
-
77
-
78
-
79
-
80
-
81
-
82
-
83
-
84
-
85
-
86
-
87
-
88
-
89
-
90
-
91
-
92
-
93
-
94
-
95
-
96
-
97
-
98
-
99
-
100
-
101
-
102
-
103
-
104
-
105
-
106
-
107
-
108
-
109
-
110
-
111
-
112
-
113
-
114
-
115
-
116
-
117
-
118
-
119
-
120
-
121
-
122
-
123
-
124
-
125
-
126
-
127
-
128
-
129
-
130
-
131
-
132
-
 133
133 -
 134
134 -
 135
135 -
 136
136 -
 137
137 -
 138
138 -
 139
139 -
 140
140 -
 141
141 -
 142
142 -
 143
143 -
 144
144 -
 145
145 -
 146
146 -
 147
147 -
 148
148 -
 149
149 -
 150
150 -
 151
151 -
 152
152 -
 153
153 -
154
-
155
-
156
-
157
-
158
-
159
-
160
-
161
-
162
-
163
-
164
-
165
-
166
-
167
-
168
-
169
-
170
-
171
-
172
-
173
-
174
-
175
-
176
-
177
-
178
-
179
-
180
-
181
-
182
-
183
-
184
-
185
-
186
-
187
-
188
-
189
-
190
-
191
-
192
-
193
-
194
-
195
-
196
-
197
-
198
-
199
-
200
-
201
-
202
-
203
-
204
-
205
-
206
-
207
-
208
-
209
-
210
-
211
-
212
-
213
-
214
-
215
-
216
-
217
-
218
-
219
-
220
-
221
-
222
-
223
-
224
-
225
-
226
-
227
-
228
-
229
-
230
-
231
-
232
-
233
-
234
-
235
-
236
-
237
-
238
-
239
-
240
-
241
-
242
-
243
-
244
-
245
-
246
-
247
-
248
-
249
-
250
-
251
-
252
-
253
-
254
-
255
-
256
-
257
-
258
-
259
-
260
-
261
-
262
-
263
-
264
-
265
-
266
-
267
-
268
-
269
-
270
-
271
-
272
-
273
-
274
-
275
-
276
-
277
-
278
-
279
-
280
-
281
-
282
-
283
-
284
-
285
-
286
-
287
-
288
-
289
-
290
 |
 |
GENERAL MOTORS COMPANY AND SUBSIDIARIES
NOTES TO CONSOLIDATED FINANCIAL STATEMENTS — (Continued)
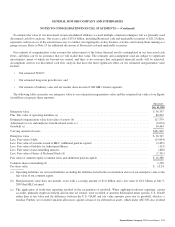
For the UST Loans and the Canadian Loan, carrying amount was determined to approximate fair value because these loans were fully
collateralized by the restricted cash placed in escrow and were entered into on July 10, 2009 at market terms. Short-term debt, current
portion of long-term debt and long-term debt decreased $1.5 billion as a result of our calculation of fair value. Refer to Note 15 for
additional information on the escrow arrangement.
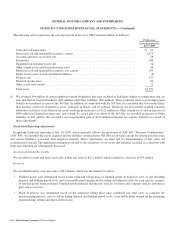
Pensions, Postretirement Benefits Other than Pensions, Current and Non-Current, and Prepaid Pensions
We recorded Pensions of $32.0 billion and Prepaid pensions of $97 million, which includes the actuarial measurement of those
benefit plans that were not modified in connection with the 363 Sale. As a result of these actuarial measurements, our recorded value
was $2.1 billion higher than Old GM’s for Pensions and Prepaid pensions for those plans not modified in connection with the 363
Sale. When the pension plans were measured at July 10, 2009, the weighted-average return on assets was 8.5% and 8.0% for U.S. and
non-U.S. plans. The weighted-average discount rate utilized to measure the plans at July 10, 2009 was 5.9% and 5.8% for U.S. and
non-U.S. plans.
We also recorded Postretirement benefits other than pensions, current and non-current of $20.4 billion, which is an increase of $434
million compared to the amounts recorded by Old GM for those plans not modified in connection with the 363 Sale. When the other
non-UAW postretirement benefit plans were measured at July 10, 2009, the weighted-average discount rate used was 6.0% and 5.5%
for the U.S. and non-U.S. plans. For the U.S. there are no significant uncapped healthcare plans remaining at December 31, 2009, and
therefore, the healthcare cost trend rate does not have a significant effect on our U.S. plans. For non-U.S. plans the initial healthcare
cost trend used was 5.4% and the ultimate healthcare cost trend rate was 3.3% with eight years to the ultimate trend rate.
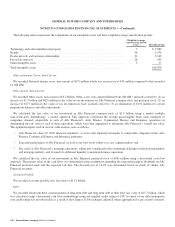
Accrued Liabilities, Other Liabilities, and Deferred Income Taxes, Current and Non-Current
We recorded Accrued liabilities of $24.4 billion and Other liabilities and deferred income taxes of $15.5 billion. Accrued liabilities
and Other liabilities differed from those of Old GM primarily relating to:
• $1.2 billion less in deferred revenue, the fair value of which was determined based on our remaining performance obligations
considering future costs associated with these obligations;
• $349 million decrease in warranty liability, the fair value of which was determined by discounting the forecasted future cash
flows based on historical claims experience using rates ranging from 1.4% in 2009 to 4.3% in 2017;
• A decrease of $179 million to lease-related obligations;
• A decrease of $162 million related to certain customer deposits;
• $582 million increase in deferred income taxes; and
• $980 million of recorded unfavorable contractual obligations, primarily related to the Delphi-GM Settlement Agreements. The
fair value of the unfavorable contractual obligations was determined by discounting forecasted cash flows representing the
unfavorable portions of contractual obligations at our implied credit rating. Refer to Note 22 for further information on the
Delphi-GM Settlement Agreements.
Equity (Deficit) and Preferred Stock
The changes to Equity (Deficit) reflect our recapitalization, the elimination of Old GM’s historical equity, the issuance of our
common stock, preferred stock and warrants to the UST, Canada Holdings and MLC at fair value, and the application of fresh-start
reporting.
General Motors Company 2010 Annual Report 141