General Motors 2010 Annual Report Download - page 66
Download and view the complete annual report
Please find page 66 of the 2010 General Motors annual report below. You can navigate through the pages in the report by either clicking on the pages listed below, or by using the keyword search tool below to find specific information within the annual report.-
 1
1 -
2
-
3
-
4
-
5
-
6
-
7
-
8
-
9
-
10
-
11
-
12
-
13
-
14
-
15
-
16
-
17
-
18
-
19
-
20
-
21
-
22
-
23
-
24
-
25
-
26
-
27
-
28
-
29
-
30
-
31
-
32
-
33
-
34
-
35
-
36
-
37
-
38
-
39
-
40
-
41
-
42
-
43
-
44
-
45
-
46
-
47
-
48
-
49
-
50
-
51
-
52
-
53
-
54
-
55
-
 56
56 -
 57
57 -
 58
58 -
 59
59 -
 60
60 -
 61
61 -
 62
62 -
 63
63 -
 64
64 -
 65
65 -
 66
66 -
 67
67 -
 68
68 -
 69
69 -
 70
70 -
 71
71 -
 72
72 -
 73
73 -
 74
74 -
 75
75 -
 76
76 -
77
-
78
-
79
-
80
-
81
-
82
-
83
-
84
-
85
-
86
-
87
-
88
-
89
-
90
-
91
-
92
-
93
-
94
-
95
-
96
-
97
-
98
-
99
-
100
-
101
-
102
-
103
-
104
-
105
-
106
-
107
-
108
-
109
-
110
-
111
-
112
-
113
-
114
-
115
-
116
-
117
-
118
-
119
-
120
-
121
-
122
-
123
-
124
-
125
-
126
-
127
-
128
-
129
-
130
-
131
-
132
-
133
-
134
-
135
-
136
-
137
-
138
-
139
-
140
-
141
-
142
-
143
-
144
-
145
-
146
-
147
-
148
-
149
-
150
-
151
-
152
-
153
-
154
-
155
-
156
-
157
-
158
-
159
-
160
-
161
-
162
-
163
-
164
-
165
-
166
-
167
-
168
-
169
-
170
-
171
-
172
-
173
-
174
-
175
-
176
-
177
-
178
-
179
-
180
-
181
-
182
-
183
-
184
-
185
-
186
-
187
-
188
-
189
-
190
-
191
-
192
-
193
-
194
-
195
-
196
-
197
-
198
-
199
-
200
-
201
-
202
-
203
-
204
-
205
-
206
-
207
-
208
-
209
-
210
-
211
-
212
-
213
-
214
-
215
-
216
-
217
-
218
-
219
-
220
-
221
-
222
-
223
-
224
-
225
-
226
-
227
-
228
-
229
-
230
-
231
-
232
-
233
-
234
-
235
-
236
-
237
-
238
-
239
-
240
-
241
-
242
-
243
-
244
-
245
-
246
-
247
-
248
-
249
-
250
-
251
-
252
-
253
-
254
-
255
-
256
-
257
-
258
-
259
-
260
-
261
-
262
-
263
-
264
-
265
-
266
-
267
-
268
-
269
-
270
-
271
-
272
-
273
-
274
-
275
-
276
-
277
-
278
-
279
-
280
-
281
-
282
-
283
-
284
-
285
-
286
-
287
-
288
-
289
-
290
 |
 |

GENERAL MOTORS COMPANY AND SUBSIDIARIES
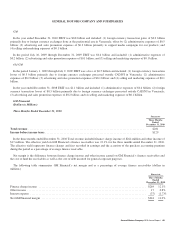
Old GM
In the period January 1, 2009 through July 9, 2009 EBIT was a loss of $2.8 billion and included: (1) charges of $0.8 billion
primarily related to the deconsolidation of Saab, which filed for reorganization protection under the laws of Sweden in February 2009;
(2) incremental depreciation charges of $0.7 billion related to restructuring activities; (3) impairment charges of $0.2 billion related to
product-specific tooling assets; and (4) operating losses of $0.2 billion related to Saab.
In the year ended December 31, 2008 EBIT was a loss of $2.6 billion and included: (1) advertising and sales promotion expenses of
$1.3 billion primarily related to support media campaigns for our products; (2) administrative expense of $0.7 billion; (3) selling and
marketing expenses of $0.7 billion related to our dealerships; (4) special tooling and product related machinery and equipment asset
impairment charges of $0.5 billion; (5) goodwill impairment charges of $0.5 billion; and (6) restructuring charges of $0.3 billion
primarily related to separation programs announced in Belgium, France, Germany and the United Kingdom.
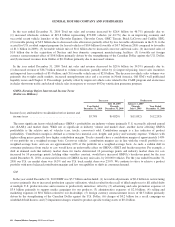
GM International Operations
(Dollars in Millions)
Successor Predecessor
Year Ended
December 31, 2010
July 10, 2009
Through
December 31, 2009
January 1, 2009
Through
July 9, 2009
Year Ended
December 31, 2008
Total net sales and revenue .......................... $21,470 $8,567 $6,218 $24,050
Income (loss) attributable to stockholders before interest
and income taxes ................................ $ 2,262 $ 789 $ (486) $ (555)
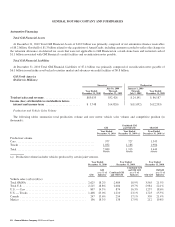
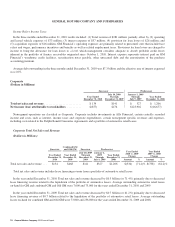
Production and Vehicle Sales Volume
The following tables summarize total production volume and new motor vehicle sales volume and competitive position (in
thousands):
GM
Combined GM
and Old GM Old GM
Year Ended
December 31, 2010
Year Ended
December 31, 2009
Year Ended
December 31, 2008
Production volume
Consolidated entities .............................................. 1,016 752 1,153
Joint ventures
SGMW (a) .................................................... 1,256 1,109 646
SGM ........................................................ 1,037 712 439
FAW-GM (a) .................................................. 86 43 —
Other ........................................................ 350 61 97
Total production volume ........................................... 3,745 2,677 2,335
(a) The joint venture agreements with SGMW (44%) and FAW-GM (50%) allow for significant rights as a member as well as the
contractual right to report SGMW and FAW-GM joint venture production in China.
64 General Motors Company 2010 Annual Report