General Motors 2010 Annual Report Download - page 98
Download and view the complete annual report
Please find page 98 of the 2010 General Motors annual report below. You can navigate through the pages in the report by either clicking on the pages listed below, or by using the keyword search tool below to find specific information within the annual report.-
 1
1 -
2
-
3
-
4
-
5
-
6
-
7
-
8
-
9
-
10
-
11
-
12
-
13
-
14
-
15
-
16
-
17
-
18
-
19
-
20
-
21
-
22
-
23
-
24
-
25
-
26
-
27
-
28
-
29
-
30
-
31
-
32
-
33
-
34
-
35
-
36
-
37
-
38
-
39
-
40
-
41
-
42
-
43
-
44
-
45
-
46
-
47
-
48
-
49
-
50
-
51
-
52
-
53
-
54
-
55
-
56
-
57
-
58
-
59
-
60
-
61
-
62
-
63
-
64
-
65
-
66
-
67
-
68
-
69
-
70
-
71
-
72
-
73
-
74
-
75
-
76
-
77
-
78
-
79
-
80
-
81
-
82
-
83
-
84
-
85
-
86
-
87
-
 88
88 -
 89
89 -
 90
90 -
 91
91 -
 92
92 -
 93
93 -
 94
94 -
 95
95 -
 96
96 -
 97
97 -
 98
98 -
 99
99 -
 100
100 -
 101
101 -
 102
102 -
 103
103 -
 104
104 -
 105
105 -
 106
106 -
 107
107 -
 108
108 -
109
-
110
-
111
-
112
-
113
-
114
-
115
-
116
-
117
-
118
-
119
-
120
-
121
-
122
-
123
-
124
-
125
-
126
-
127
-
128
-
129
-
130
-
131
-
132
-
133
-
134
-
135
-
136
-
137
-
138
-
139
-
140
-
141
-
142
-
143
-
144
-
145
-
146
-
147
-
148
-
149
-
150
-
151
-
152
-
153
-
154
-
155
-
156
-
157
-
158
-
159
-
160
-
161
-
162
-
163
-
164
-
165
-
166
-
167
-
168
-
169
-
170
-
171
-
172
-
173
-
174
-
175
-
176
-
177
-
178
-
179
-
180
-
181
-
182
-
183
-
184
-
185
-
186
-
187
-
188
-
189
-
190
-
191
-
192
-
193
-
194
-
195
-
196
-
197
-
198
-
199
-
200
-
201
-
202
-
203
-
204
-
205
-
206
-
207
-
208
-
209
-
210
-
211
-
212
-
213
-
214
-
215
-
216
-
217
-
218
-
219
-
220
-
221
-
222
-
223
-
224
-
225
-
226
-
227
-
228
-
229
-
230
-
231
-
232
-
233
-
234
-
235
-
236
-
237
-
238
-
239
-
240
-
241
-
242
-
243
-
244
-
245
-
246
-
247
-
248
-
249
-
250
-
251
-
252
-
253
-
254
-
255
-
256
-
257
-
258
-
259
-
260
-
261
-
262
-
263
-
264
-
265
-
266
-
267
-
268
-
269
-
270
-
271
-
272
-
273
-
274
-
275
-
276
-
277
-
278
-
279
-
280
-
281
-
282
-
283
-
284
-
285
-
286
-
287
-
288
-
289
-
290
 |
 |

GENERAL MOTORS COMPANY AND SUBSIDIARIES
(d) The 260 million shares of Series A Preferred Stock, 263 million shares of our common stock, and warrant to acquire 46 million
shares of our common stock issued to the New VEBA on July 10, 2009 were not considered outstanding until the UAW retiree
medical plan was settled on December 31, 2009. The fair value of these instruments was included in the liability recognized at
July 10, 2009 for this plan. The common shares issued to the New VEBA are excluded from common shares outstanding at
July 10, 2009. Refer to Note 20 to our consolidated financial statements for a discussion of the termination of our UAW hourly
retiree medical plan and Mitigation Plan and the resulting payment terms to the New VEBA.
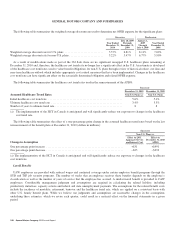
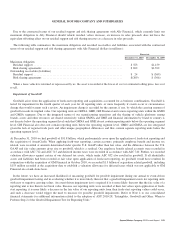
The following table summarizes the approximate effects that a change in the WACC and long-term growth rate assumptions would
have had on our determination of the fair value of our common equity at July 10, 2009 keeping all other assumptions constant (dollars
in billions except per share amounts):
Change in Assumption
Effect on Fair
Value of Common
Equity at
July 10, 2009
Effect on
Per Share
Value at
July 10, 2009
Two percentage point decrease in WACC ................................................. +$2.9 +$2.35
Two percentage point increase in WACC ................................................. –$2.4 –$1.92
One percentage point increase in long-term growth rate ...................................... +$0.5 +$0.40
One percentage point decrease in long-term growth rate ..................................... –$0.5 –$0.37
In order to estimate these effects, we adjusted the WACC and long-term growth rate assumptions for each of Old GM’s former
segments and for certain subsidiaries. The aggregated effect of these assumption changes on each of Old GM’s former segments and
for certain subsidiaries does not necessarily correspond to assumption changes made at a consolidated level.
Pensions
The defined benefit pension plans are accounted for on an actuarial basis, which requires the selection of various assumptions,
including an expected rate of return on plan assets and a discount rate. Due to significant events, including those discussed in Note 20
to our consolidated financial statements, certain of the pension plans were remeasured at various dates in the year ended December 31,
2010, the periods July 10, 2009 through December 31, 2009, January 1, 2009 through July 9, 2009 and in the year ended
December 31, 2008.
Net pension expense is calculated based on the expected return on plan assets and not the actual return on plan assets. The expected
return on U.S. plan assets that is included in pension expense is determined from periodic studies, which include a review of asset
allocation strategies, anticipated future long-term performance of individual asset classes, risks using standard deviations and
correlations of returns among the asset classes that comprise the plans’ asset mix. While the studies give appropriate consideration to
recent plan performance and historical returns, the assumptions are primarily long-term, prospective rates of return. In December 2010
an analysis of the investment policy was completed for the U.S. pension plans which reduced the expected return on assets to 8.0%
from 8.5% at December 31, 2009. The decrease in expected return on assets is primarily related to lower bond yields and updated
return assumptions for equities and equity-like asset classes. Differences between the expected return on plan assets and the actual
return on plan assets are recorded in Accumulated other comprehensive income (loss) as an actuarial gain or loss, and subject to
possible amortization into net pension expense over future periods. A market-related value of plan assets, which averages gains and
losses over a period of years, is utilized in the determination of future pension expense. For substantially all pension plans, market-
related value is defined as an amount that initially recognizes 60.0% of the difference between the actual fair value of assets and the
expected calculated value, and 10.0% of that difference over each of the next four years. The market-related value of assets at
December 31, 2010 used to determine U.S. and non-U.S. net periodic pension income for the year ending December 31, 2011 was
$4.1 billion and $0.3 billion lower than the actual fair value of plan assets at December 31, 2010.
Another key assumption in determining net pension expense is the assumed discount rate to be used to discount plan obligations.
We estimate this rate for U.S. plans using a cash flow matching approach, which uses projected cash flows matched to spot rates along
96 General Motors Company 2010 Annual Report