RBS 2012 Annual Report Download - page 100
Download and view the complete annual report
Please find page 100 of the 2012 RBS annual report below. You can navigate through the pages in the report by either clicking on the pages listed below, or by using the keyword search tool below to find specific information within the annual report.-
 1
1 -
2
-
3
-
4
-
5
-
6
-
7
-
8
-
9
-
10
-
11
-
12
-
13
-
14
-
15
-
16
-
17
-
18
-
19
-
20
-
21
-
22
-
23
-
24
-
25
-
26
-
27
-
28
-
29
-
30
-
31
-
32
-
33
-
34
-
35
-
36
-
37
-
38
-
39
-
40
-
41
-
42
-
43
-
44
-
45
-
46
-
47
-
48
-
49
-
50
-
51
-
52
-
53
-
54
-
55
-
56
-
57
-
58
-
59
-
60
-
61
-
62
-
63
-
64
-
65
-
66
-
67
-
68
-
69
-
70
-
71
-
72
-
73
-
74
-
75
-
76
-
77
-
78
-
79
-
80
-
81
-
82
-
83
-
84
-
85
-
86
-
87
-
88
-
89
-
 90
90 -
 91
91 -
 92
92 -
 93
93 -
 94
94 -
 95
95 -
 96
96 -
 97
97 -
 98
98 -
 99
99 -
 100
100 -
 101
101 -
 102
102 -
 103
103 -
 104
104 -
 105
105 -
 106
106 -
 107
107 -
 108
108 -
 109
109 -
 110
110 -
111
-
112
-
113
-
114
-
115
-
116
-
117
-
118
-
119
-
120
-
121
-
122
-
123
-
124
-
125
-
126
-
127
-
128
-
129
-
130
-
131
-
132
-
133
-
134
-
135
-
136
-
137
-
138
-
139
-
140
-
141
-
142
-
143
-
144
-
145
-
146
-
147
-
148
-
149
-
150
-
151
-
152
-
153
-
154
-
155
-
156
-
157
-
158
-
159
-
160
-
161
-
162
-
163
-
164
-
165
-
166
-
167
-
168
-
169
-
170
-
171
-
172
-
173
-
174
-
175
-
176
-
177
-
178
-
179
-
180
-
181
-
182
-
183
-
184
-
185
-
186
-
187
-
188
-
189
-
190
-
191
-
192
-
193
-
194
-
195
-
196
-
197
-
198
-
199
-
200
-
201
-
202
-
203
-
204
-
205
-
206
-
207
-
208
-
209
-
210
-
211
-
212
-
213
-
214
-
215
-
216
-
217
-
218
-
219
-
220
-
221
-
222
-
223
-
224
-
225
-
226
-
227
-
228
-
229
-
230
-
231
-
232
-
233
-
234
-
235
-
236
-
237
-
238
-
239
-
240
-
241
-
242
-
243
-
244
-
245
-
246
-
247
-
248
-
249
-
250
-
251
-
252
-
253
-
254
-
255
-
256
-
257
-
258
-
259
-
260
-
261
-
262
-
263
-
264
-
265
-
266
-
267
-
268
-
269
-
270
-
271
-
272
-
273
-
274
-
275
-
276
-
277
-
278
-
279
-
280
-
281
-
282
-
283
-
284
-
285
-
286
-
287
-
288
-
289
-
290
-
291
-
292
-
293
-
294
-
295
-
296
-
297
-
298
-
299
-
300
-
301
-
302
-
303
-
304
-
305
-
306
-
307
-
308
-
309
-
310
-
311
-
312
-
313
-
314
-
315
-
316
-
317
-
318
-
319
-
320
-
321
-
322
-
323
-
324
-
325
-
326
-
327
-
328
-
329
-
330
-
331
-
332
-
333
-
334
-
335
-
336
-
337
-
338
-
339
-
340
-
341
-
342
-
343
-
344
-
345
-
346
-
347
-
348
-
349
-
350
-
351
-
352
-
353
-
354
-
355
-
356
-
357
-
358
-
359
-
360
-
361
-
362
-
363
-
364
-
365
-
366
-
367
-
368
-
369
-
370
-
371
-
372
-
373
-
374
-
375
-
376
-
377
-
378
-
379
-
380
-
381
-
382
-
383
-
384
-
385
-
386
-
387
-
388
-
389
-
390
-
391
-
392
-
393
-
394
-
395
-
396
-
397
-
398
-
399
-
400
-
401
-
402
-
403
-
404
-
405
-
406
-
407
-
408
-
409
-
410
-
411
-
412
-
413
-
414
-
415
-
416
-
417
-
418
-
419
-
420
-
421
-
422
-
423
-
424
-
425
-
426
-
427
-
428
-
429
-
430
-
431
-
432
-
433
-
434
-
435
-
436
-
437
-
438
-
439
-
440
-
441
-
442
-
443
-
444
-
445
-
446
-
447
-
448
-
449
-
450
-
451
-
452
-
453
-
454
-
455
-
456
-
457
-
458
-
459
-
460
-
461
-
462
-
463
-
464
-
465
-
466
-
467
-
468
-
469
-
470
-
471
-
472
-
473
-
474
-
475
-
476
-
477
-
478
-
479
-
480
-
481
-
482
-
483
-
484
-
485
-
486
-
487
-
488
-
489
-
490
-
491
-
492
-
493
-
494
-
495
-
496
-
497
-
498
-
499
-
500
-
501
-
502
-
503
-
504
-
505
-
506
-
507
-
508
-
509
-
510
-
511
-
512
-
513
-
514
-
515
-
516
-
517
-
518
-
519
-
520
-
521
-
522
-
523
-
524
-
525
-
526
-
527
-
528
-
529
-
530
-
531
-
532
-
533
-
534
-
535
-
536
-
537
-
538
-
539
-
540
-
541
-
542
-
543
 |
 |

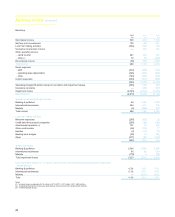
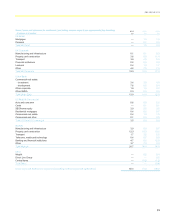
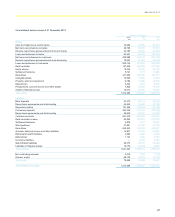
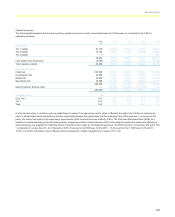
Commentary on consolidated balance sheet - managed and
statutory
2012 compared with 2011
Total assets of £1,312.3 billion at 31 December 2012 were down £194.6
billion, 13%, compared with 31 December 2011. This was principally
driven by a decrease in loans and advances to banks and customers led
by Non-Core disposals and run off, decreases in debt securities and the
continuing reduction in the mark-to-market value of derivatives.
Loans and advances to banks decreased by £19.4 billion, 23%, to £64.0
billion. Excluding reverse repurchase agreements and stock borrowing
(‘reverse repos’), down £4.7 billion, 12%, to £34.8 billion, bank placings
declined £14.7 billion, 34%, to £29.2 billion.
Loans and advances to customers declined £15.5 billion, 3%, to £500.1
billion. Within this, reverse repurchase agreements were up £8.6 billion,
14%, to £70.0 billion. Customer lending decreased by £24.0 billion, 5%,
to £430.1 billion, or £22.6 billion to £451.2 billion before impairments.
This reflected reductions in Non-Core of £22.6 billion, along with declines
in International Banking, £14.3 billion, UK Corporate, £2.9 billion,
Markets, £1.0 billion and Ulster Bank, £0.7 billion, together with the effect
of exchange rate and other movements, £4.7 billion. These were partially
offset by the transfer from disposal groups of £18.9 billion of customer
balances relating to the UK branch-based businesses, together with
underlying growth in UK Retail, £2.6 billion, US Retail & Commercial,
£1.9 billion and Wealth, £0.2 billion.
Debt securities were down £51.6 billion, 25%, to £157.4 billion, driven
mainly by reductions within Markets and Group Treasury in holdings of
UK and Eurozone government securities and financial institution bonds.
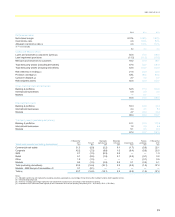
Settlement balance assets and liabilities decreased £2.0 billion to £5.7
billion and £1.6 billion to £5.9 billion respectively reflecting the overall
reduction in the size of the balance sheet.
Movements in the value of derivative assets, down £87.7 billion, 17%, to
£441.9 billion, and liabilities, down £89.7 billion, 17%, to £434.3 billion,
primarily reflect decreases in interest rate and credit derivative contracts,
together with the effect of currency movements, with Sterling
strengthening against both the US dollar and the Euro.
Intangible assets decreased £1.3 billion, 9%, to £13.5 billion, primarily as
a result of write-down of the Direct Line Group goodwill, £0.4 billion, and
the transfer of the remaining £0.5 billion of goodwill together with £0.2
billion of other intangible assets to assets of disposal groups at 31
December 2012.
Property, plant and equipment decreased by £2.1 billion, 18%, to £9.8
billion driven largely by the disposal of investment property in Non-Core.
The decrease in assets and liabilities of disposal groups, down £11.4
billion, 45%, to £14.0 billion, and £13.8 billion, 58%, to £10.2 billion
respectively, primarily reflects the removal of the UK branch-based
businesses from disposal groups following Santander’s withdrawal from
the purchase, together with the disposal of RBS Aviation Capital in the
second quarter. These were partly offset by the transfer to disposal
groups of Direct Line Group at 31 December 2012.
Deposits by banks decreased £7.4 billion, 7%, to £101.4 billion, with a
decrease in inter-bank deposits, down £12.0 billion, 17%, to £57.1 billion.
This was partly offset by an increase in repurchase agreements and
stock lending (‘repos’), up £4.6 billion, 12%, to £44.3 billion, improving the
Group’s mix of secured and unsecured funding.
Customer accounts increased £18.3 billion, 4%, to £521.3 billion. Within
this, repos decreased £0.8 billion, 1%, to £88.0 billion. Excluding repos,
customer deposits were up £19.1 billion, 5%, at £433.2 billion, primarily
reflecting the transfer from disposal groups of £21.5 billion of customer
accounts relating to the UK branch-based businesses together with
underlying increases in UK Retail, £6.0 billion, International Banking, £2.0
million, US Retail & Commercial, £1.8 billion, UK Corporate, £0.8 billion,
Ulster Bank, £0.7 billion and Wealth, £0.7 billion. This was partially offset
by decreases in Markets, £9.7 billion, and Non-Core, £0.9 billion, together
with exchange and other movements £3.8 billion.
Debt securities in issue decreased £68.0 billion, 42%, to £94.6 billion
reflecting the maturity of the remaining notes issued under the UK
Government’s Credit Guarantee Scheme, £21.3 billion, the repurchase of
bonds and medium term notes as a result of the liability management
exercise completed in September 2012, £4.4 billion, and the continuing
reduction of commercial paper and medium term notes in issue in line
with the Group’s strategy.
Short positions were down £13.4 billion, 33%, to £27.6 billion mirroring
decreases in debt securities.
Retirement benefit liabilities increased by £1.6 billion, 73%, to £3.9 billion
with net actuarial losses of £2.3 billion on the Group's defined benefit
pension schemes, primarily arising from significant reductions in the real
discount rates in the Sterling, Euro and US dollar currency zones. These
were partially offset by the £0.6 billion excess of employer contributions
paid over the current year pension charge.
Insurance liabilities of £6.2 billion relating to Direct Line Group were
transferred to liabilities of disposal groups at 31 December 2012.
Subordinated liabilities increased by £0.5 billion, 2% to £26.8 billion,
primarily as a result of the net increase in dated loan capital. Issuances of
£1.4 billion and redemptions of £0.3 billion were partly offset by a net
decrease of £0.6 billion arising from the liability management exercise
completed in March 2012, which consisted of redemptions of £3.4 billion
offset by the issuance of £2.8 billion new loan capital.
Non-controlling interests increased by £1.1 billion, 88%, to £2.3 billion,
predominantly due to the sale of 34.7% of the Group’s investment in
Direct Line Group during the fourth quarter.
Owner’s equity decreased by £6.7 billion, 9%, to £68.1 billion, driven by
the £6.0 billion attributable loss for the period together with movements in
foreign exchange reserves, £0.9 billion, the recognition of actuarial losses
in respect of the Group’s defined benefit pension schemes, net of tax,
£1.9 billion, and other reserve movements of £0.2 billion. Partially
offsetting these reductions were gains in available-for-sale reserves, £0.6
billion, and cash flow hedging reserves, £0.8 billion, share capital and
reserve movements in respect of employee share schemes, £0.8 billion
and other share issuances of £1.0 billion.
98
Business review continued