RBS 2012 Annual Report Download - page 169
Download and view the complete annual report
Please find page 169 of the 2012 RBS annual report below. You can navigate through the pages in the report by either clicking on the pages listed below, or by using the keyword search tool below to find specific information within the annual report.-
 1
1 -
2
-
3
-
4
-
5
-
6
-
7
-
8
-
9
-
10
-
11
-
12
-
13
-
14
-
15
-
16
-
17
-
18
-
19
-
20
-
21
-
22
-
23
-
24
-
25
-
26
-
27
-
28
-
29
-
30
-
31
-
32
-
33
-
34
-
35
-
36
-
37
-
38
-
39
-
40
-
41
-
42
-
43
-
44
-
45
-
46
-
47
-
48
-
49
-
50
-
51
-
52
-
53
-
54
-
55
-
56
-
57
-
58
-
59
-
60
-
61
-
62
-
63
-
64
-
65
-
66
-
67
-
68
-
69
-
70
-
71
-
72
-
73
-
74
-
75
-
76
-
77
-
78
-
79
-
80
-
81
-
82
-
83
-
84
-
85
-
86
-
87
-
88
-
89
-
90
-
91
-
92
-
93
-
94
-
95
-
96
-
97
-
98
-
99
-
100
-
101
-
102
-
103
-
104
-
105
-
106
-
107
-
108
-
109
-
110
-
111
-
112
-
113
-
114
-
115
-
116
-
117
-
118
-
119
-
120
-
121
-
122
-
123
-
124
-
125
-
126
-
127
-
128
-
129
-
130
-
131
-
132
-
133
-
134
-
135
-
136
-
137
-
138
-
139
-
140
-
141
-
142
-
143
-
144
-
145
-
146
-
147
-
148
-
149
-
150
-
151
-
152
-
153
-
154
-
155
-
156
-
157
-
158
-
 159
159 -
 160
160 -
 161
161 -
 162
162 -
 163
163 -
 164
164 -
 165
165 -
 166
166 -
 167
167 -
 168
168 -
 169
169 -
 170
170 -
 171
171 -
 172
172 -
 173
173 -
 174
174 -
 175
175 -
 176
176 -
 177
177 -
 178
178 -
 179
179 -
180
-
181
-
182
-
183
-
184
-
185
-
186
-
187
-
188
-
189
-
190
-
191
-
192
-
193
-
194
-
195
-
196
-
197
-
198
-
199
-
200
-
201
-
202
-
203
-
204
-
205
-
206
-
207
-
208
-
209
-
210
-
211
-
212
-
213
-
214
-
215
-
216
-
217
-
218
-
219
-
220
-
221
-
222
-
223
-
224
-
225
-
226
-
227
-
228
-
229
-
230
-
231
-
232
-
233
-
234
-
235
-
236
-
237
-
238
-
239
-
240
-
241
-
242
-
243
-
244
-
245
-
246
-
247
-
248
-
249
-
250
-
251
-
252
-
253
-
254
-
255
-
256
-
257
-
258
-
259
-
260
-
261
-
262
-
263
-
264
-
265
-
266
-
267
-
268
-
269
-
270
-
271
-
272
-
273
-
274
-
275
-
276
-
277
-
278
-
279
-
280
-
281
-
282
-
283
-
284
-
285
-
286
-
287
-
288
-
289
-
290
-
291
-
292
-
293
-
294
-
295
-
296
-
297
-
298
-
299
-
300
-
301
-
302
-
303
-
304
-
305
-
306
-
307
-
308
-
309
-
310
-
311
-
312
-
313
-
314
-
315
-
316
-
317
-
318
-
319
-
320
-
321
-
322
-
323
-
324
-
325
-
326
-
327
-
328
-
329
-
330
-
331
-
332
-
333
-
334
-
335
-
336
-
337
-
338
-
339
-
340
-
341
-
342
-
343
-
344
-
345
-
346
-
347
-
348
-
349
-
350
-
351
-
352
-
353
-
354
-
355
-
356
-
357
-
358
-
359
-
360
-
361
-
362
-
363
-
364
-
365
-
366
-
367
-
368
-
369
-
370
-
371
-
372
-
373
-
374
-
375
-
376
-
377
-
378
-
379
-
380
-
381
-
382
-
383
-
384
-
385
-
386
-
387
-
388
-
389
-
390
-
391
-
392
-
393
-
394
-
395
-
396
-
397
-
398
-
399
-
400
-
401
-
402
-
403
-
404
-
405
-
406
-
407
-
408
-
409
-
410
-
411
-
412
-
413
-
414
-
415
-
416
-
417
-
418
-
419
-
420
-
421
-
422
-
423
-
424
-
425
-
426
-
427
-
428
-
429
-
430
-
431
-
432
-
433
-
434
-
435
-
436
-
437
-
438
-
439
-
440
-
441
-
442
-
443
-
444
-
445
-
446
-
447
-
448
-
449
-
450
-
451
-
452
-
453
-
454
-
455
-
456
-
457
-
458
-
459
-
460
-
461
-
462
-
463
-
464
-
465
-
466
-
467
-
468
-
469
-
470
-
471
-
472
-
473
-
474
-
475
-
476
-
477
-
478
-
479
-
480
-
481
-
482
-
483
-
484
-
485
-
486
-
487
-
488
-
489
-
490
-
491
-
492
-
493
-
494
-
495
-
496
-
497
-
498
-
499
-
500
-
501
-
502
-
503
-
504
-
505
-
506
-
507
-
508
-
509
-
510
-
511
-
512
-
513
-
514
-
515
-
516
-
517
-
518
-
519
-
520
-
521
-
522
-
523
-
524
-
525
-
526
-
527
-
528
-
529
-
530
-
531
-
532
-
533
-
534
-
535
-
536
-
537
-
538
-
539
-
540
-
541
-
542
-
543
 |
 |

RBS GROUP 2012
167
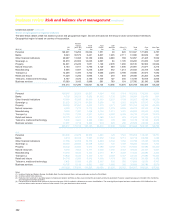
2012 2011 2010
AQ10 credit risk assets by division AQ10
£m
Divisional credit
risk assets
%
AQ10
£m
Divisional credit
risk assets
%
AQ10
£m
Divisional credit
risk assets
%
UK Retail 4,998 4.4 5,097 4.6 5,017 4.6
UK Corporate 6,310 6.25,484 5.2 5,198 4.8
International Banking 612 0.9 1,736 2.4 2,227 2.8
Ulster Bank 8,236 24.16,305 16.7 4,348 10.7
US Retail & Commercial 633 1.2646 1.1 599 1.2
Retail & Commercial 20,789 5.3 19,268 4.8 17,389 4.3
Markets 773 0.7 749 0.7 605 0.5
Core 21,5623.8 20,017 3.4 17,994 3.2
Non-Core 22,845 35.025,020 27.0 25,005 19.9
44,4077.145,037 6.7 42,999 6.2
Key points
x Trends in the asset quality of the Group’s credit risk exposures
during 2012 reflected changes in the composition of the Core
portfolio and the run-off and disposals of Non-Core assets as well as
regrading through new and updated models, particularly in relation
to the bank and personal sectors. Adjusting for those factors, the
overall asset quality of the Group’s corporate exposure was broadly
unchanged despite difficult external conditions in the UK and
ongoing uncertainty in the eurozone.
x The decrease in the Group’s Core exposures within the AQ1 band
reflects the decrease in the Group’s exposure to sovereigns in
Western Europe and North America and the change in the bank and
sovereign Probability of Default (PD) rating models noted on page
162. The credit outlook for banks and sovereigns continues to be
challenging and the transition to the updated PD models creates
additional credit migration causing assets to move to higher PDs.
While the nominal value and appearance of migration out of AQ1 is
material most of the migration continues to occur within the range of
stronger credit grades and hence the change in the credit quality of
the portfolio is modest. The weighted PD percentage for banks and
sovereigns increased by 5 basis points to 0.13% and 3 basis points
to 0.04% respectively. The AQ composition of the Corporate
portfolio has not changed materially during the year.
x The increase in AQ4 is partly driven by the change to the bank and
sovereign PD models noted above, and partly due to the
improvement in the UK Retail mortgage asset quality band
distribution. This followed updates to the Group’s models which
were delayed whilst long term recalibrations were made to the
capital rating system. These PD recalibrations reflect improvements
in the underlying credit quality of the UK mortgage portfolio.
x On a sector basis, the proportion of non-performing assets in the
property sector increased slightly to 58% of total AQ10 exposure
(2011 - 57%). Non-performing assets relating to property represent
a material proportion of AQ10 exposure in Non-Core (85%), UK
Corporate (56%) and Ulster Bank (30%). In particular, continued
weakness in the Irish economy meant non-performing assets in the
Ulster Bank portfolio continued to grow, driven by exposures in the
personal and property sectors. Refer to the Key credit portfolios:
Ulster Bank Group (pages 190 to 193) for more details. A small
number of significant individual non-performing property cases led to
the overall increase in the AQ10 population in UK Corporate.
x Non-performing assets (AQ10) in Non-Core increased as a
percentage of the overall Non-Core portfolio due to the run-off and
disposals of better performing assets. The overall level of AQ10
assets in Non-Core fell due to repayments, assets returning to the
performing book and the write off of certain real estate exposures in
2012.
x In UK Retail non-performing assets (AQ10) reduced slightly during
the year predominantly as a result of lower flows of unsecured
assets into non-performing. Recovery activity on non-performing
assets is pursued over a number of years during which time the
assets remain on balance sheet along with the appropriate
impairment provision.
x Non-performing credit risk assets within International Banking
decreased markedly as renegotiations led to the return of significant
exposure in the transport sector to the performing book.