RBS 2012 Annual Report Download - page 187
Download and view the complete annual report
Please find page 187 of the 2012 RBS annual report below. You can navigate through the pages in the report by either clicking on the pages listed below, or by using the keyword search tool below to find specific information within the annual report.-
 1
1 -
2
-
3
-
4
-
5
-
6
-
7
-
8
-
9
-
10
-
11
-
12
-
13
-
14
-
15
-
16
-
17
-
18
-
19
-
20
-
21
-
22
-
23
-
24
-
25
-
26
-
27
-
28
-
29
-
30
-
31
-
32
-
33
-
34
-
35
-
36
-
37
-
38
-
39
-
40
-
41
-
42
-
43
-
44
-
45
-
46
-
47
-
48
-
49
-
50
-
51
-
52
-
53
-
54
-
55
-
56
-
57
-
58
-
59
-
60
-
61
-
62
-
63
-
64
-
65
-
66
-
67
-
68
-
69
-
70
-
71
-
72
-
73
-
74
-
75
-
76
-
77
-
78
-
79
-
80
-
81
-
82
-
83
-
84
-
85
-
86
-
87
-
88
-
89
-
90
-
91
-
92
-
93
-
94
-
95
-
96
-
97
-
98
-
99
-
100
-
101
-
102
-
103
-
104
-
105
-
106
-
107
-
108
-
109
-
110
-
111
-
112
-
113
-
114
-
115
-
116
-
117
-
118
-
119
-
120
-
121
-
122
-
123
-
124
-
125
-
126
-
127
-
128
-
129
-
130
-
131
-
132
-
133
-
134
-
135
-
136
-
137
-
138
-
139
-
140
-
141
-
142
-
143
-
144
-
145
-
146
-
147
-
148
-
149
-
150
-
151
-
152
-
153
-
154
-
155
-
156
-
157
-
158
-
159
-
160
-
161
-
162
-
163
-
164
-
165
-
166
-
167
-
168
-
169
-
170
-
171
-
172
-
173
-
174
-
175
-
176
-
 177
177 -
 178
178 -
 179
179 -
 180
180 -
 181
181 -
 182
182 -
 183
183 -
 184
184 -
 185
185 -
 186
186 -
 187
187 -
 188
188 -
 189
189 -
 190
190 -
 191
191 -
 192
192 -
 193
193 -
 194
194 -
 195
195 -
 196
196 -
 197
197 -
198
-
199
-
200
-
201
-
202
-
203
-
204
-
205
-
206
-
207
-
208
-
209
-
210
-
211
-
212
-
213
-
214
-
215
-
216
-
217
-
218
-
219
-
220
-
221
-
222
-
223
-
224
-
225
-
226
-
227
-
228
-
229
-
230
-
231
-
232
-
233
-
234
-
235
-
236
-
237
-
238
-
239
-
240
-
241
-
242
-
243
-
244
-
245
-
246
-
247
-
248
-
249
-
250
-
251
-
252
-
253
-
254
-
255
-
256
-
257
-
258
-
259
-
260
-
261
-
262
-
263
-
264
-
265
-
266
-
267
-
268
-
269
-
270
-
271
-
272
-
273
-
274
-
275
-
276
-
277
-
278
-
279
-
280
-
281
-
282
-
283
-
284
-
285
-
286
-
287
-
288
-
289
-
290
-
291
-
292
-
293
-
294
-
295
-
296
-
297
-
298
-
299
-
300
-
301
-
302
-
303
-
304
-
305
-
306
-
307
-
308
-
309
-
310
-
311
-
312
-
313
-
314
-
315
-
316
-
317
-
318
-
319
-
320
-
321
-
322
-
323
-
324
-
325
-
326
-
327
-
328
-
329
-
330
-
331
-
332
-
333
-
334
-
335
-
336
-
337
-
338
-
339
-
340
-
341
-
342
-
343
-
344
-
345
-
346
-
347
-
348
-
349
-
350
-
351
-
352
-
353
-
354
-
355
-
356
-
357
-
358
-
359
-
360
-
361
-
362
-
363
-
364
-
365
-
366
-
367
-
368
-
369
-
370
-
371
-
372
-
373
-
374
-
375
-
376
-
377
-
378
-
379
-
380
-
381
-
382
-
383
-
384
-
385
-
386
-
387
-
388
-
389
-
390
-
391
-
392
-
393
-
394
-
395
-
396
-
397
-
398
-
399
-
400
-
401
-
402
-
403
-
404
-
405
-
406
-
407
-
408
-
409
-
410
-
411
-
412
-
413
-
414
-
415
-
416
-
417
-
418
-
419
-
420
-
421
-
422
-
423
-
424
-
425
-
426
-
427
-
428
-
429
-
430
-
431
-
432
-
433
-
434
-
435
-
436
-
437
-
438
-
439
-
440
-
441
-
442
-
443
-
444
-
445
-
446
-
447
-
448
-
449
-
450
-
451
-
452
-
453
-
454
-
455
-
456
-
457
-
458
-
459
-
460
-
461
-
462
-
463
-
464
-
465
-
466
-
467
-
468
-
469
-
470
-
471
-
472
-
473
-
474
-
475
-
476
-
477
-
478
-
479
-
480
-
481
-
482
-
483
-
484
-
485
-
486
-
487
-
488
-
489
-
490
-
491
-
492
-
493
-
494
-
495
-
496
-
497
-
498
-
499
-
500
-
501
-
502
-
503
-
504
-
505
-
506
-
507
-
508
-
509
-
510
-
511
-
512
-
513
-
514
-
515
-
516
-
517
-
518
-
519
-
520
-
521
-
522
-
523
-
524
-
525
-
526
-
527
-
528
-
529
-
530
-
531
-
532
-
533
-
534
-
535
-
536
-
537
-
538
-
539
-
540
-
541
-
542
-
543
 |
 |

RBS GROUP 2012
185
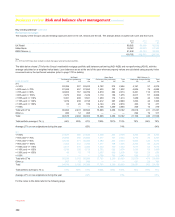
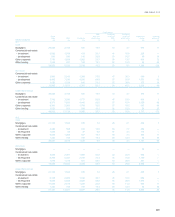
The table below analyses commercial real estate (Core and Non-Core) lending by loan-to-value (LTV) which represents loan value before provisions.
Due to market conditions in Ireland and to a lesser extent in the UK, there is a shortage of market-based data. In the absence of external valuations, the
Group deploys a range of alternative approaches to assess property values, including internal expert judgement and indexation.
Ulster Bank Rest of the Group Group
Loan-to-value Performing
£m
Non-performing
£m
Total
£m
Performing
£m
Non-performing
£m
Total
£m
Performing
£m
Non-performing
£m
Total
£m
2012
<= 50% 183 24 2077,210 281 7,491 7,393 305 7,698
> 50% and <= 70% 326 102 42812,161996 13,157 12,487 1,098 13,585
> 70% and <= 90% 462 250 712 6,438 1,042 7,480 6,900 1,292 8,192
> 90% and <= 100% 466 141 6071,5422,145 3,687 2,008 2,286 4,294
> 100% and <= 110% 103 596 699 1,0191,449 2,468 1,122 2,045 3,167
> 110% and <= 130% 326 630 956 901 1,069 1,970 1,227 1,699 2,926
> 130% and <= 150% 274 878 1,152322 913 1,235 596 1,791 2,387
> 150% 963 7,290 8,253 595 1,962 2,557 1,558 9,252 10,810
Total with LTVs 3,103 9,911 13,01430,188 9,857 40,045 33,291 19,768 53,059
Minimal security (1) 7 1,461 1,468 3 13 16 10 1,474 1,484
Other (2) 97 715 812 6,494 1,191 7,685 6,591 1,906 8,497
Total 3,207 12,087 15,294 36,685 11,061 47,746 39,892 23,148 63,040
Total portfolio average LTV (3) 131% 286% 249% 65% 125% 80% 71% 206% 122%
2011
<= 50% 272 32 3047,091332 7,423 7,363 364 7,727
> 50% and <= 70% 479 127 60614,105 984 15,089 14,584 1,111 15,695
> 70% and <= 90% 808 332 1,1401
0,0421,191 11,233 10,850 1,523 12,373
> 90% and <= 100% 438 201 639 2,6161,679 4,295 3,054 1,880 4,934
> 100% and <= 110% 474 390 864 1,5241,928 3,452 1,998 2,318 4,316
> 110% and <= 130% 527 1,101 1,628 698 1,039 1,737 1,225 2,140 3,365
> 130% and <= 150% 506 1,066 1,572239 912 1,151 745 1,978 2,723
> 150% 912 7,472 8,384 433 2,082 2,515 1,345 9,554 10,899
Total with LTVs 4,416 10,721 15,137 36,748 10,147 46,895 41,164 20,868 62,032
Minimal security (1) 72 1,086 1,158 — — — 72 1,086 1,158
Other (2) 193 625 818 8,994 1,844 10,838 9,187 2,469 11,656
Total 4,681 12,432 17,113 45,74211,991 57,733 50,423 24,423 74,846
Total portfolio average LTV (3) 120% 264% 222% 69% 129% 82% 75% 203% 116%
Notes:
(1) In 2012, the Group reclassified loans with limited or non-physical security (defined as LTV>1,000%) as minimal security, for which a majority are commercial real estate development loans in Ulster
Bank. Total portfolio average LTV is quoted net of loans with minimal security given that the anticipated recovery rate is less than 10%. Provisions are marked against these loans where required to
reflect asset quality and recovery profile. 2011 presentation has been revised.
(2) Other performing loans of £6.6 billion (2011 - £9.2 billion) include general corporate lending, typically unsecured, to commercial real estate companies, and major UK housebuilders. The credit quality
of these exposures is consistent with that of the performing portfolio overall. Other non-performing loans of £1.9 billion (2011 - £2.5 billion) are subject to the Group’s standard provisioning policies.
(3) Weighted average by exposure.
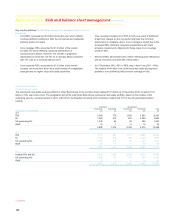
Key points
x 81% of the commercial real estate portfolio categorised as LTV >
100% was in Ulster Bank Group (Core - 15%; Non-Core - 43%) and
International Banking (Non-Core - 23%). A majority of the portfolios
are managed within GRG and are subject to review at least quarterly.
Significant levels of provisions have been taken against these
portfolios. Provisions as a percentage of REIL for the Ulster Bank
Group commercial real estate portfolio were 58% at 31 December
2012 (2011 - 53%).
x The average interest coverage ratios for UK Corporate (Core and
Non-Core) and International Banking (Non-Core) were 2.96x and
1.30x respectively, at 31 December 2012 (2011 - 2.71x and 1.25x,
respectively). The US Retail & Commercial portfolio is managed on
the basis of debt service coverage, which includes scheduled
principal amortisation. The average debt service coverage for this
portfolio was 1.34x at 31 December 2012 (2011 - 1.24x). As a
number of different approaches are used within the Group and
across geographies to calculate interest coverage ratios, they may
not be comparable for different portfolio types and organisations.