RBS 2012 Annual Report Download - page 49
Download and view the complete annual report
Please find page 49 of the 2012 RBS annual report below. You can navigate through the pages in the report by either clicking on the pages listed below, or by using the keyword search tool below to find specific information within the annual report.-
 1
1 -
2
-
3
-
4
-
5
-
6
-
7
-
8
-
9
-
10
-
11
-
12
-
13
-
14
-
15
-
16
-
17
-
18
-
19
-
20
-
21
-
22
-
23
-
24
-
25
-
26
-
27
-
28
-
29
-
30
-
31
-
32
-
33
-
34
-
35
-
36
-
37
-
38
-
 39
39 -
 40
40 -
 41
41 -
 42
42 -
 43
43 -
 44
44 -
 45
45 -
 46
46 -
 47
47 -
 48
48 -
 49
49 -
 50
50 -
 51
51 -
 52
52 -
 53
53 -
 54
54 -
 55
55 -
 56
56 -
 57
57 -
 58
58 -
 59
59 -
60
-
61
-
62
-
63
-
64
-
65
-
66
-
67
-
68
-
69
-
70
-
71
-
72
-
73
-
74
-
75
-
76
-
77
-
78
-
79
-
80
-
81
-
82
-
83
-
84
-
85
-
86
-
87
-
88
-
89
-
90
-
91
-
92
-
93
-
94
-
95
-
96
-
97
-
98
-
99
-
100
-
101
-
102
-
103
-
104
-
105
-
106
-
107
-
108
-
109
-
110
-
111
-
112
-
113
-
114
-
115
-
116
-
117
-
118
-
119
-
120
-
121
-
122
-
123
-
124
-
125
-
126
-
127
-
128
-
129
-
130
-
131
-
132
-
133
-
134
-
135
-
136
-
137
-
138
-
139
-
140
-
141
-
142
-
143
-
144
-
145
-
146
-
147
-
148
-
149
-
150
-
151
-
152
-
153
-
154
-
155
-
156
-
157
-
158
-
159
-
160
-
161
-
162
-
163
-
164
-
165
-
166
-
167
-
168
-
169
-
170
-
171
-
172
-
173
-
174
-
175
-
176
-
177
-
178
-
179
-
180
-
181
-
182
-
183
-
184
-
185
-
186
-
187
-
188
-
189
-
190
-
191
-
192
-
193
-
194
-
195
-
196
-
197
-
198
-
199
-
200
-
201
-
202
-
203
-
204
-
205
-
206
-
207
-
208
-
209
-
210
-
211
-
212
-
213
-
214
-
215
-
216
-
217
-
218
-
219
-
220
-
221
-
222
-
223
-
224
-
225
-
226
-
227
-
228
-
229
-
230
-
231
-
232
-
233
-
234
-
235
-
236
-
237
-
238
-
239
-
240
-
241
-
242
-
243
-
244
-
245
-
246
-
247
-
248
-
249
-
250
-
251
-
252
-
253
-
254
-
255
-
256
-
257
-
258
-
259
-
260
-
261
-
262
-
263
-
264
-
265
-
266
-
267
-
268
-
269
-
270
-
271
-
272
-
273
-
274
-
275
-
276
-
277
-
278
-
279
-
280
-
281
-
282
-
283
-
284
-
285
-
286
-
287
-
288
-
289
-
290
-
291
-
292
-
293
-
294
-
295
-
296
-
297
-
298
-
299
-
300
-
301
-
302
-
303
-
304
-
305
-
306
-
307
-
308
-
309
-
310
-
311
-
312
-
313
-
314
-
315
-
316
-
317
-
318
-
319
-
320
-
321
-
322
-
323
-
324
-
325
-
326
-
327
-
328
-
329
-
330
-
331
-
332
-
333
-
334
-
335
-
336
-
337
-
338
-
339
-
340
-
341
-
342
-
343
-
344
-
345
-
346
-
347
-
348
-
349
-
350
-
351
-
352
-
353
-
354
-
355
-
356
-
357
-
358
-
359
-
360
-
361
-
362
-
363
-
364
-
365
-
366
-
367
-
368
-
369
-
370
-
371
-
372
-
373
-
374
-
375
-
376
-
377
-
378
-
379
-
380
-
381
-
382
-
383
-
384
-
385
-
386
-
387
-
388
-
389
-
390
-
391
-
392
-
393
-
394
-
395
-
396
-
397
-
398
-
399
-
400
-
401
-
402
-
403
-
404
-
405
-
406
-
407
-
408
-
409
-
410
-
411
-
412
-
413
-
414
-
415
-
416
-
417
-
418
-
419
-
420
-
421
-
422
-
423
-
424
-
425
-
426
-
427
-
428
-
429
-
430
-
431
-
432
-
433
-
434
-
435
-
436
-
437
-
438
-
439
-
440
-
441
-
442
-
443
-
444
-
445
-
446
-
447
-
448
-
449
-
450
-
451
-
452
-
453
-
454
-
455
-
456
-
457
-
458
-
459
-
460
-
461
-
462
-
463
-
464
-
465
-
466
-
467
-
468
-
469
-
470
-
471
-
472
-
473
-
474
-
475
-
476
-
477
-
478
-
479
-
480
-
481
-
482
-
483
-
484
-
485
-
486
-
487
-
488
-
489
-
490
-
491
-
492
-
493
-
494
-
495
-
496
-
497
-
498
-
499
-
500
-
501
-
502
-
503
-
504
-
505
-
506
-
507
-
508
-
509
-
510
-
511
-
512
-
513
-
514
-
515
-
516
-
517
-
518
-
519
-
520
-
521
-
522
-
523
-
524
-
525
-
526
-
527
-
528
-
529
-
530
-
531
-
532
-
533
-
534
-
535
-
536
-
537
-
538
-
539
-
540
-
541
-
542
-
543
 |
 |

RBS GROUP 2012
47
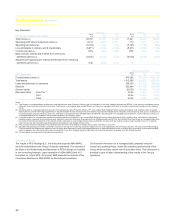
Insurance net claims
General insurance claims were £541 million lower, primarily reflecting
lower volumes, higher reserve releases and improved claims experience,
more than offsetting an increase of £85 million in Home weather events
claims.
Impairment losses
Impairment losses fell to £5,279 million from £7,439 million in 2011, with
Core impairments falling by £464 million and Non-Core by £1,696 million,
mostly in the Ulster Bank and commercial real estate portfolios.
Impairments represented 1.2% of gross loans and advances excluding
reverse repos compared with 1.5% in 2011.
Risk elements in lending at 31 December 2012 represented 9.1% of
loans and advances excluding reverse repos, compared with 8.6% a year
earlier. Provision coverage was 52%, compared with 49% at 31
December 2011.
Non-operating items
The continuing strengthening RBS’s credit profile resulted in a £4,649
million accounting charge in relation to own credit adjustments versus a
gain of £1,914 million in 2011. This reflected a tightening of more than
340 basis points in the Group’s credit spreads over the year.
The Asset Protection Scheme, which the Group exited from during the
year, was accounted for as a credit derivative and movements in the fair
value of the contract were taken as non-operating items. The APS fair
value charge was £44 million in 2012 bringing the cumulative charge for
the APS to £2.5 billion.
To reflect current experience of Payment Protection Insurance complaints
received, the Group increased its PPI provision by £1,110 million in 2012
compared with £850 million in 2011, bringing the cumulative charge taken
to £2.2 billion, of which £1.3 billion (59%) in redress had been paid by 31
December 2012.
In 2011, the Group recorded an impairment loss of £1,099 million in
respect of its AFS portfolio of Greek government debt. In 2012, the vast
majority of this portfolio was exchanged for Greek sovereign debt and
European Financial Stability Facility notes; the Greek sovereign debt
received in the exchange was sold.
Integration and restructuring costs of £1,550 million increased by £486
million versus £1,064 million in 2011, primarily driven by costs incurred in
relation to the strategic restructuring of Markets and International Banking
(M&IB) that took place during 2012.
Liability management exercises undertaken by the Group during 2012
resulted in a net gain of £454 million (2011 - £255 million).
The UK bank levy is based on the total chargeable equity and liabilities
as reported in the balance sheet at the end of a chargeable period. The
cost of the levy to the Group for 2012 was £175 million compared with
£300 million in 2011.
Interest Rate Hedging Products redress and related costs
Following an industry-wide review conducted in conjunction with the
Financial Services Authority, a charge of £700 million has been booked
for redress in relation to certain interest-rate hedging products sold to
small and medium-sized businesses classified as retail clients under FSA
rules.
Regulatory fines
On 6 February 2013, RBS reached agreement with the Financial
Services Authority, the US Department of Justice and the Commodity
Futures Trading Commission in relation to the setting of LIBOR and other
trading rates, including financial penalties of £381 million. The Group
continues to co-operate with other bodies in this regard and expects it will
incur some additional financial penalties.
Tax
The tax charge was £469 million in 2012, compared with £1,127 million in
2011. The high tax charge in the year reflects profits in high tax regimes
(principally US) and losses in low tax regimes (principally Ireland), losses
in overseas subsidiaries for which a deferred tax asset has not been
recognised (principally Ireland), the reduction in the carrying value of
deferred tax assets in Ireland in view of continuing losses, the reduction
in the carrying value of deferred tax assets in Australia following the
strategic changes to the Markets and International Banking businesses
announced in January 2012 and the effect of the two reductions of 1% in
the rate of UK corporation tax enacted in March 2012 and July 2012 on
the net deferred tax balance.
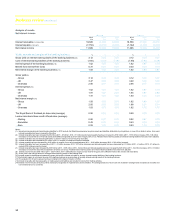
Earnings per share
Basic loss per ordinary and B share from continuing operations was
53.7p per share compared with 21.3p per share in 2011. Adjusted
earnings per ordinary and B share from continuing operations was 6.3p
compared with a loss per share of 0.8p in 2011.
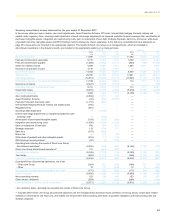
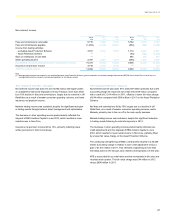
2012 compared with 2011 - statutory
Operating loss
Operating loss before tax for the year was £5,165 million compared with
£1,190 million in 2011.
Total income
Total income decreased 27% to £17,941 million in 2012.
Net interest income
Net interest income decreased by 7% to £11,402 million.
Non-interest income
Non-interest income decreased to £6,539 million from £12,348 million in
2011. This included movements in the fair value of the Asset Protection
Scheme resulting in a £44 million charge (2011 - £906 million), net gain
on redemption of own debt of £454 million (2011 - £255 million) and a
loss on own credit adjustments of £4,649 million (2011 - £1,914 million
gain). Excluding these items, non-interest income was down 3%
compared with 2011.